This month, I explore just how old medical devices are as measured by the date they were cleared or approved by the FDA, using the Global Unique Device Identification Database.
That database is the only one that FDA maintains that gives insight into specifically what devices are currently marketed in the United States. And of course, this being unpacking averages, I don’t just want the average, but I want to understand the range.
Results
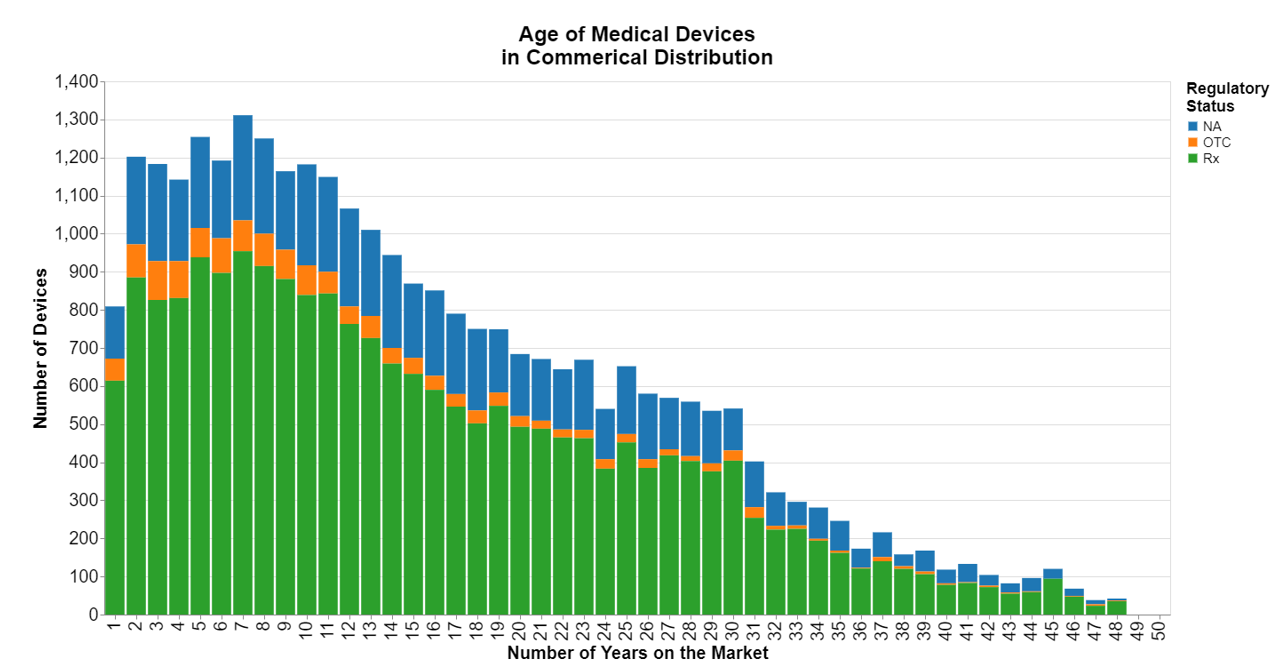
I wanted to see the data stratified by regulatory status, i.e. prescription, over-the-counter, or status not disclosed.

Turns out medical devices are anywhere from 1 to 48 years old, with 7 years presently being the most common, or statistically the mode.
Methodology
I used the Access GUDID Delimited Full Release dataset as of July 1, 2024. That data set is actually several data sets combined, and for this analysis I used the premarket submissions, product codes and devices datasets. I combined them all using the primary DI. I then filtered the data set to only those devices presently in commercial distribution. I removed those that were exempt from premarket notification because, well, I couldn't do anything with exempt devices. Even for nonexempt devices, I got rid of any devices where the submission had not been provided. There were not many of these.
The Access GUDID also has many duplicate entries for the same device. As a result, I got rid of all the duplicates using the name of the device.
Some of the devices referenced multiple submissions, and I took the largest K number. I realize that submissions do not always get cleared in the order submitted, but it seemed like a reasonable approximation of the most recent submission FDA cleared for a device. Once I selected the most relevant K number, I used the 510(k) database to obtain the date of that clearance.
To create the image above, I simply made bins for each year products got cleared.
Analysis
While the mode is 7 years, I calculated the mean to be just over 15 years. The curve looks pretty much as you would expect, with a peak around seven years but then a gradual decline. I was surprised by the length of the tail going all the way to 48 years, but also the fact that those last 15 years are not immaterial. The tail is thicker than I thought it would be. There apparently are some tried and true medical devices in low technology innovation spaces that seem to be enduring. Either that or more cynically, some medical devices stay on the market longer than they should.
I also expected there to be more of a hump, but frankly years two through 12 are reasonably equal. The crest at year 7 isn't much.
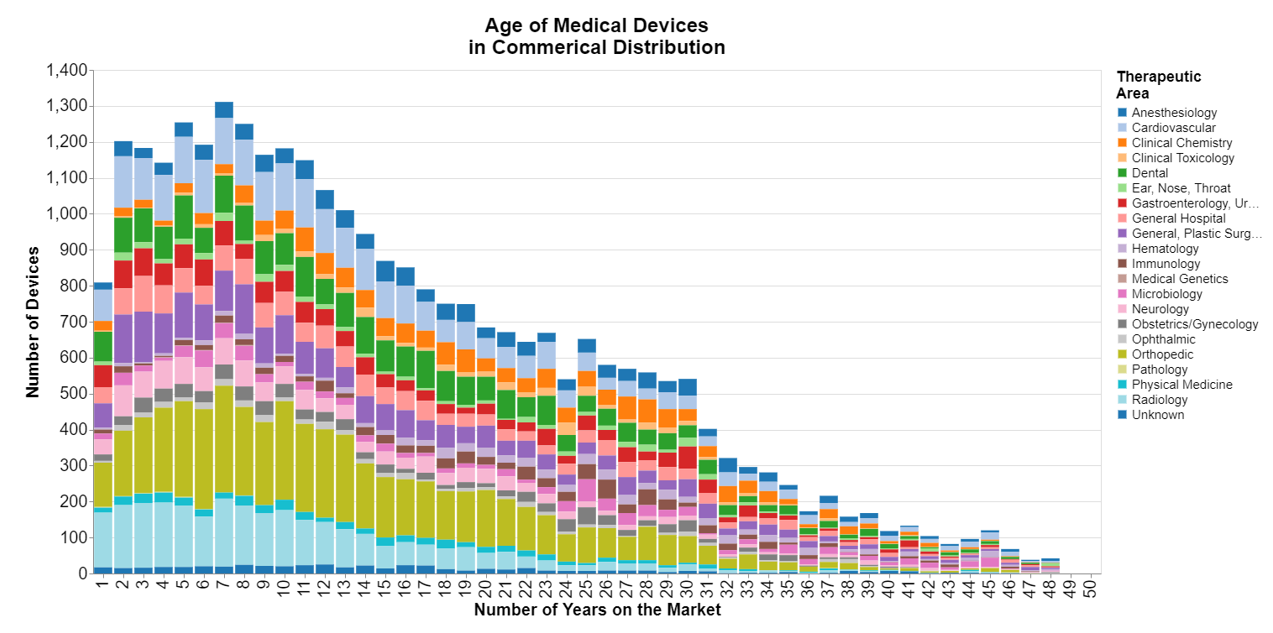
The long tail made me wonder what type of devices were remaining on the market. As a result, I redid the chart, this time including the therapeutic area.

It looks a bit garish because I had to use a color spectrum that included 20 distinct colors. But apart from that, it appears that no particular therapeutic area is responsible for the long tail. Pretty much all the therapeutic areas have some devices that are more than 30 years on the market.
Conclusions
My only real take away this month is that it's common in all areas of medical devices for some products to remain on the market a remarkably long time. The life cycle is also defined by a fairly gradual decline from year 11 to year 48. After that first decade, there is not a sharp drop off, in fact there's no sharp drop off at any point.
Not all companies are deliberate about a life cycle, retiring products when certain criteria are met. If the devices continue to sell, then typically they will be continued to be sold. That may or may not be OK. This chart doesn't tell us anything about whether there are problems associated with the old devices. That's a post for another day.


 />i
/>i
