Combination products present a tremendous opportunity to improve health outcomes, because they leverage multiple disciplines. If we were, for example, to focus on drugs alone with little thought to how they might be delivered, we would be surely missing a chance to enhance safety or effectiveness. Likewise, many devices can be made more effective or safer if paired with a drug.
At the end of 2016, FDA finalized a rule covering Postmarket Safety Reporting for Combination Products that now can be found at 21 C.F.R. Subpart B.[1] A few years later, in July 2019, FDA finalized a guidance document explaining the new rule.[2] The new rule and the guidance were an attempt by FDA to sort out some of the complexities and duplication found in the different adverse event reporting systems for drugs, biologics and medical devices. If your company was, for example, the manufacturer of a medical device that was incorporated by a drug company into a finished combination product, you might wonder what your responsibilities were to report any adverse events for the combination product under the medical device reporting regulations.
About five years have passed since the guidance came out, so I thought I would take a look at the data on reported adverse events for combination products. At a high level, given the regulatory system for combination products that assigns regulatory responsibility to an FDA center based on which underlying constituent part (i.e., the drug or the device) supplies the primary mode of action (i.e., produces the therapeutic effect), we divide the world into drug- or biologic-lead combination products on the one hand, and medical device-lead combination products on the other.
Drug-Lead Combination Products
Turns out, we the public do not have access to data on the adverse events associated with drug-lead combination products. That’s frustrating. I dug into the openFDA data sets for the FDA Adverse Event Reporting System, which is where FDA publicly releases data on drug adverse events, and I did not find any data on whether a particular adverse event was associated with a combination product.[3] That is despite the fact that under the new rule, FDA does in fact collect in its adverse event reports information on whether a combination product is involved.
As a result, I asked the people responsible for openFDA, and this is what they told me. “Unfortunately, FDA Adverse Event Reporting System (FAERS) Quarterly Data Extract Files, which openFDA uses as a source for its Drug AE API, do not contain any information about safety reports for CDER and CBER-regulated combination products, and the openFDA team is unaware of a workaround. You would need to contact the FDA directly to see if this is going to change in the future.”
Dead-end I guess, unless someone files a FOIA request.
Device-Lead Combination Products
Here I met with success, because CDRH has released this data field in the MDR data set.
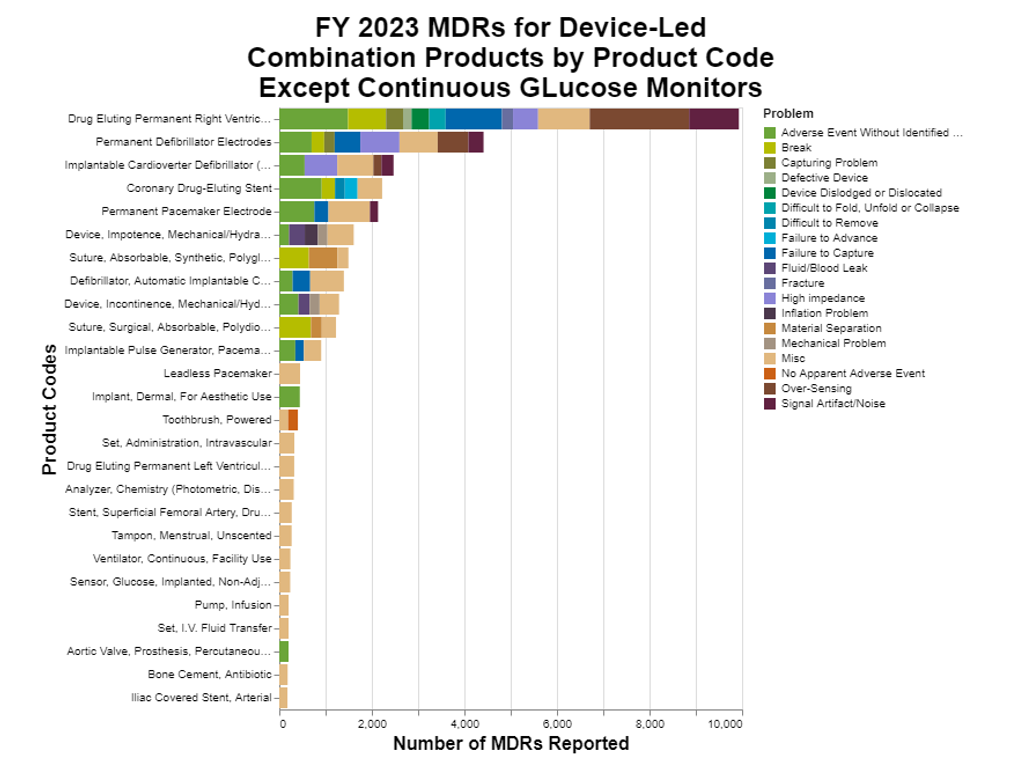
The first thing that I noticed was that by a huge share, the most frequent adverse events were from continuous glucose monitors. Those data were so large that they dwarfed everything else. As a result, in preparing the chart below, I removed continuous glucose monitors so that we could see what else is going on.
There is a lot of information to unpack.
Methodology
This data analysis was straightforward. I first filtered all the MDR data for fiscal year 2023 to limit it to just initial submissions. Then I got rid of all the MDRs where the combination product field was left blank. That was only a handful, about a dozen. I then selected only those MDRs where the submission indicated that the product at issue was indeed a combination product. For fiscal year 2023, that produced just under 300,000 MDRs.
In looking at the remaining data, that's when I realized that a huge portion was for continuous glucose monitors. For my initial version of the graph, including all 300,000 distorted the chart because almost 88% were from the one product category. Including them made everything else look so small in comparison that it was hard to even read the chart, so I removed them. That left about 36,600 MDRs which are depicted in the chart.
To add the information regarding the product problems, I limited the chart to the most common 18 problems and put everything else in miscellaneous. Why 18? Because that corresponds to at least 150 MDRs that include the particular product problem.
Interpretation
As you can see, the highest remaining sources of MDRs are all in the cardiac device space. That should not be surprising, both because combination products have been very popular in that space, and the technologies are often high risk.
From a product problem standpoint, the biggest grouping is green, which is where the MDR did not include a specific problem. This should not be confused with my miscellaneous category where the problem was identified, but the problem was infrequent.
Some adverse events are a fact of life. It’s reassuring to me that there don’t appear to any predominant causes. If there were, presumably the manufacturers would focus on those.
Conclusion
I think most people are probably already aware that continuous glucose monitors have been generating adverse events. They have been around since 2017. That’s not news. And indeed, FDA just cleared the first over-the-counter continuous glucose monitor in March of this year.[4]
The fact that popular, high risk cardiac devices are producing some adverse events is also not surprising. On the whole, I was rather comforted by the data, although I know engineers are never satisfied and will always continue to try to improve performance.
I was disappointed, though, in the lack of availability regarding adverse event information for drug-lead combination products. I know I’m a bit of a nerd, okay a big nerd, but I really wish that data were available.
[1] https://www.ecfr.gov/current/title-21/chapter-I/subchapter-A/part-4/subpart-B


 />i
/>i


