
 />i
/>iI may be jumping the gun here, but I’m anxious to understand how the new flurry of AI medical devices is performing in the marketplace, or more specifically, whether the devices are failing to perform in a way that jeopardizes health.
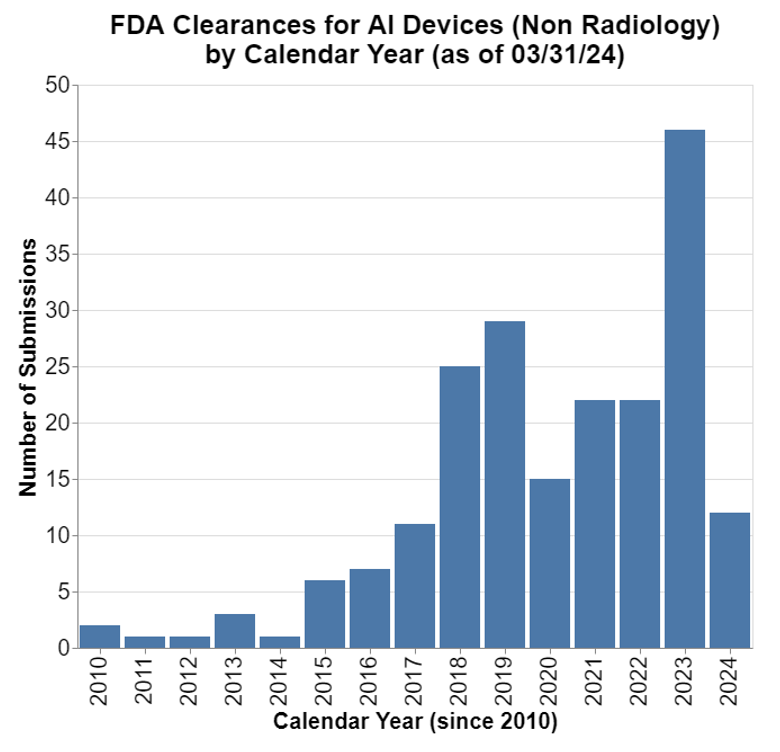
FDA keeps a list these days of medical devices that involve AI, and here’s the recent growth in clearances or other approvals.
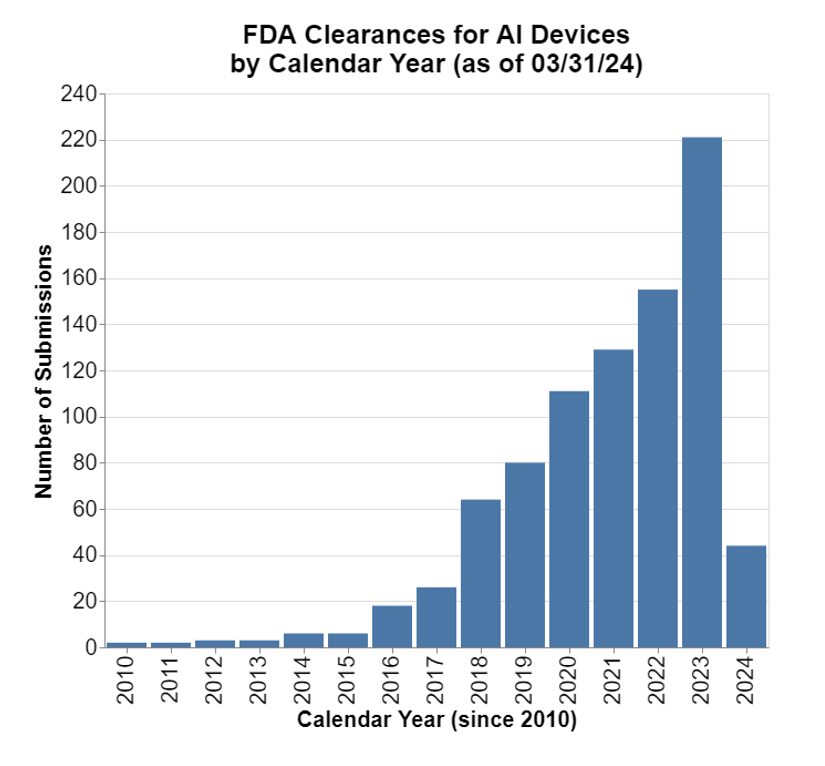
Note for calendar year 2024, we only have first-quarter data.
The growth is notable. As these devices enter the market, they are subject to all the typical medical device postmarket regulatory obligations including medical device reporting or MDRs (21 CFR Part 803). The postmarket experience is highly relevant to the discussions ongoing about what to do with this new category of medical devices, and whether a different approach to regulating such products is necessary.
Findings
Given the growth especially over the last five years (i.e., since April 1, 2019), I wanted to see, as these new products enter the market, whether they are producing MDRs, and if so to what magnitude, as well as understanding better any specific failures.
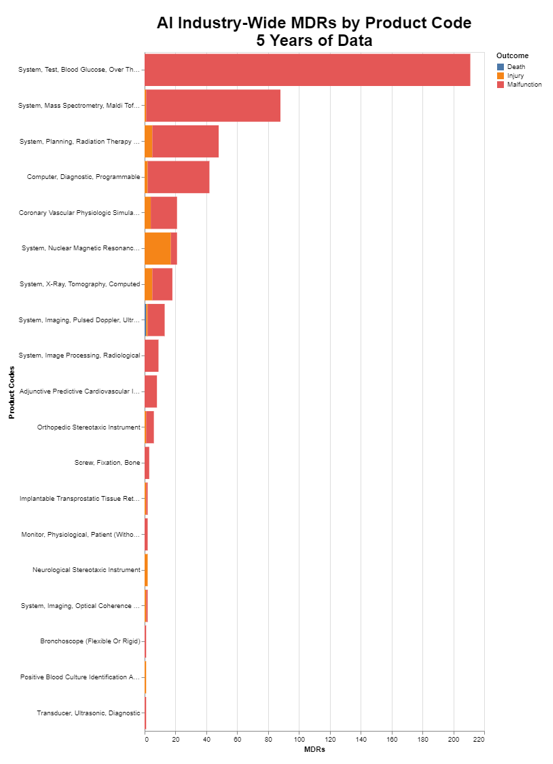
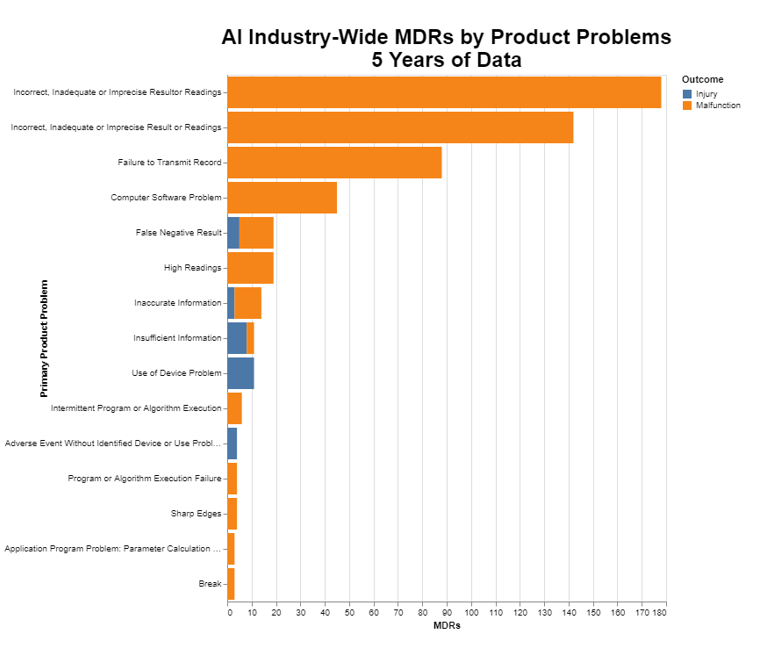
The above chart obviously illustrates the level of MDRs, stratified by death, injury and malfunction. I want to go deeper into the data and understand exactly the nature of the MDRs. That leads me to the next chart that identifies the root cause of the MDRs.
Methodology
The methodology this month was simple. FDA publishes a list of all AI driven medical devices here. Starting with that list, I used the premarket clearance numbers to search the MDR database. Then I just sorted that database, first by the product codes to see into what buckets the MDRs fell, and then again by the top failure modes.
Interpretation
1. Therapeutic Areas Involved
Before interpreting those findings, I think it’s important to put them in some context. One of the first things I note is the very high preponderance of submissions in radiology.
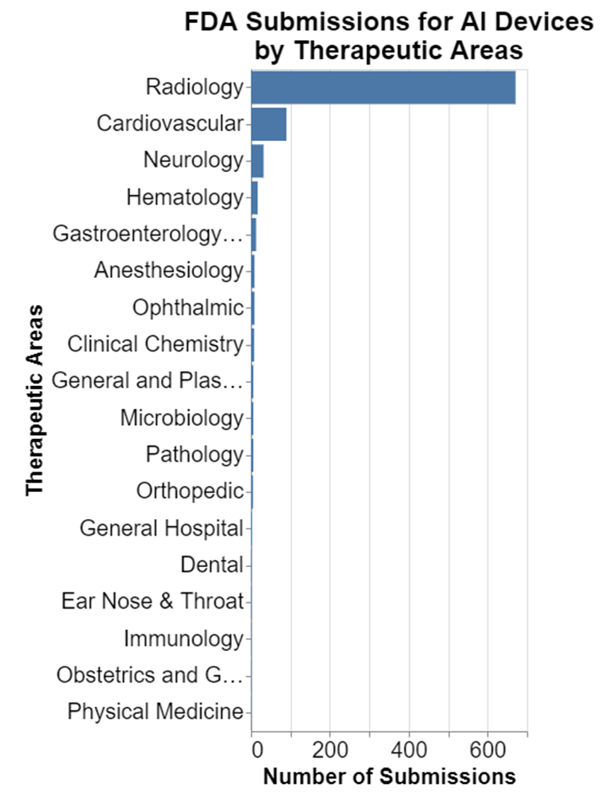
Given that, I wanted to take radiology out of the equation so that it doesn't skew the results so much.
Obviously, there is still growth, but it isn't nearly as dramatic. That's disappointing. But it's important context to understanding the MDR data presented above.
Next, I want to understand exactly what kinds of devices are being cleared with AI outside of radiology. I selected only those submissions where at least three have been granted in a particular clinical area, otherwise the list is too long.
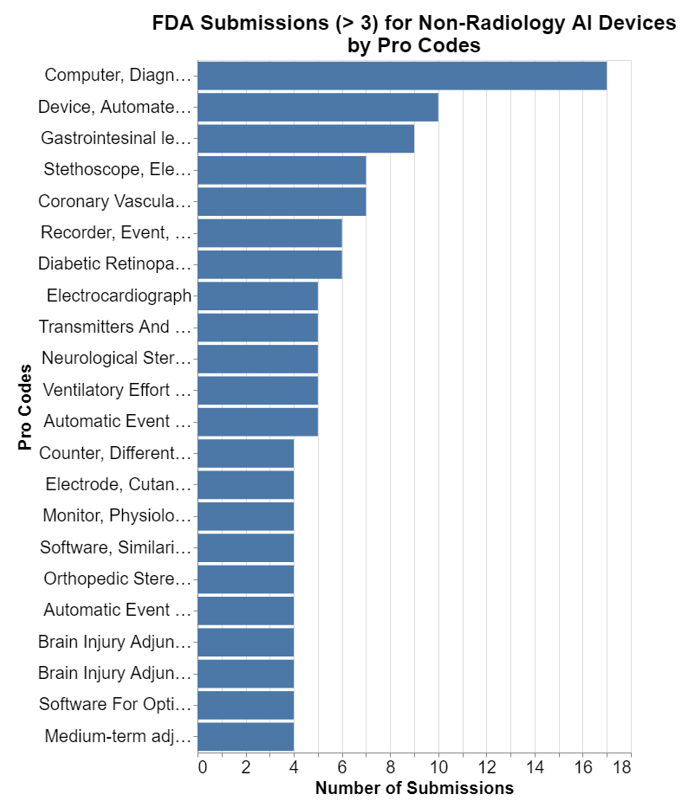
The top use outside radiology is what I would call general clinical decision support software or CDS, software that is not specific or related to a device such that it becomes an accessory to a parent medical device. In the grand scheme of things, outside of radiology, we are dealing with relatively small numbers. As a result, the MDRs must be read in that context as well.
So, let's go back to the MDR data in light of this knowledge of the submissions that have been made. I find MDR data difficult to assess in the abstract, because I know from years of practicing regulatory law that all sorts of squirrely things can end up as MDRs. MDRs are an imperfect way of assessing the presence of device defects. As a result, what I find useful is comparing devices against each other in terms of the MDRs they produce.
2. The Central Tendency of the AI Dataset Vs. All Medical Devices
I want to start by acknowledging there is high variability and skew in the data sets representing MDRs for all medical devices. There are a few medical devices that are responsible for a huge number of MDRs, and likewise there are a huge number of medical devices that are each responsible for very few MDRs. The spread is enormous and certainly not linear. But I still think there's some value in looking at and comparing the central tendency of the datasets to see where AI devices are coming out vis-à-vis other devices.
I therefore calculated the central tendencies of the two data sets. For the AI devices, I grouped the last five years altogether because I wanted a large enough pool of data. But for all other medical devices in my comparator, I’m just going to look at the last calendar year: specifically, calendar year 2023. I like to use calendar years instead of the government’s fiscal year because most people can relate better to the calendar year.
I first calculated the mean for medical devices in calendar year 2023. To do so, I took as my denominator all medical device submissions for which an MDR had been reported, then I divided that into the number of MDRs for calendar year 2023, and I got 230. In other words, for 2023, the average device submission for which there was one MDR at least had 230 MDRs.
In my opinion, the mean has limited value because, as I said above, if you’re familiar the data, you know that there’s a handful of devices that produce huge number of MDRs each year. And then of course there are devices that may only produce a couple of MDRs every year. There’s a very wide divergence between low producing and high producing devices. As a result, to get a better characterization of the central tendency, I calculated the mode and the median.
The mode statistic for MDRs for all devices (which as you recall is the most common number) is just one. The median number which is arithmetically the center if you listed the numbers in order is 4. Given the mean of 230, that tells you that there are some devices out there which are really causing a tremendous number of MDRs, while the vast majority produce only a few.
Unfortunately, this method also excludes devices for which there were no MDRs. Thus, the number is artificially high. I don’t know good way around that, because I wouldn’t want to simply divide by the total number of products that have ever gotten cleared because plenty of those products are no longer on the market. I considered using data from the Global Unique Device Identification Database but I’m honestly not sure how well manufacturers keep that data current. When I searched that database, I found fewer unique submission numbers in commercial distribution than the number of submission numbers currently causing MDRs. I suppose that's possible if old devices are in the market causing MDRs, but I really don't think it's likely, so I decided not to use that number.
Calculating similar central tendency statistics for the subset of AI devices, I collected data for the five years, but then to make it comparable, divided the numbers by 5 so that they would compare better to a single year statistic. Obviously, there's a problem with that in that AI devices have been growing so we should expect a number greater in 2023 than it was in 2019, but as you will see the numbers are pretty low regardless across all years.
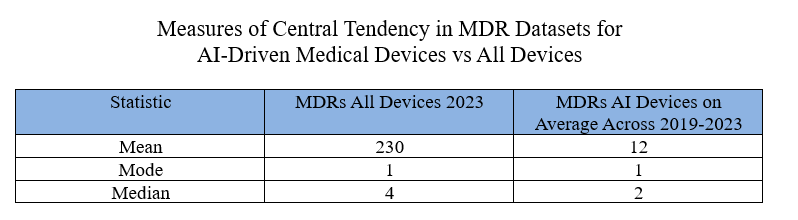
Admittedly, the AI driven devices represent a small sample. In some ways, the mean is the least meaningful comparison simply because in the full data set there are a few outliers that really bump up the numbers. The median is probably more meaningful.
3. Looking At Specific Devices
Now let's go back to looking at the original charts with the MDRs associated with AI submissions.
- The highest number which relates to the product code for system test blood glucose produced is 210 MDRs over five years, or an average of 42 per year. Now that's for all the AI devices in that product code, so to put this in context, you need to look at my chart on the number of submissions per product code. I truncated that at 3 because otherwise it was just too long. Consulting my raw data, I see that there were two submissions in that product code for AI. Thus, the 42 would be divided by two to get 21 per device per year. That's the biggest number on the chart.
- For system mass spectroscopy, there were 83 MDRs over the five years, or just over 16 per year. Checking my list of the number of submissions per product code, again there were two, so that means eight MDRs per device in that category per year.
- For system planning radiation therapy, there were 43 MDRs over five years, or just over eight per year. But here, as already noted, there are quite a few more radiation submissions. In this case, actually 21. So that means on average there was only 0.4 MDRs pre submission in that category per year.
I’m going to stop because the numbers get quite trivial.
Really in every way, AI devices are currently producing fewer MDRs than the medical device universe in general. The qualitative analysis of looking at the top producing MDRs in the AI device data set shows a very modest number of MDRs on an annual basis for those producing the greatest number of MDRs.
On the one hand, all these numbers need to be tempered by the fact that the numbers are so small on the AI-driven medical device side. But on the other hand, those small numbers bolster the ultimate point which is that we do not yet seem to have any safety signal strongly emanating from the AI driven medical devices.
4. Root Cause Interpretation
Since we are talking about machine learning, it’s perhaps not surprising that the most common root cause for an AI device MDR is an inaccurate result. Machine learning algorithms used in medicine at this juncture produce either quantitative or qualitative results for end users to consider, as opposed to autonomously controlling therapy, for example. In looking at the top two product problems in the chart, together they are about 320 of the almost 600 MDRs for the whole data set, or more than half just in those two causes. The chart doesn’t, by itself, indicate how serious those are, other than indicating whether they produced an injury or a malfunction.
As the third and fourth most common, there are almost 90 failures to transmit and more than 40 other computer issues, which in terms of seriousness would depend very much on whether the device is being used in an acute setting. From there, the numbers become pretty small.
There is very little surprising in those data, which in an MDR analysis is a comforting thing.
Conclusions
I started this by asking the rhetorical question of whether it’s too early to start looking at MDR data for AI devices, and you could make the case that it is. But at the same time, many devices in this category have been approved for five years or more, and so if there were problems, we would expect to see at least some early signs. I do not find any early signs of broad, systemic concerns.
On the whole, the profile of MDRs for AI driven medical devices is better than the profile for medical devices in general. These data certainly do not suggest that we need any heightened level of review or a more rigorous process for AI driven devices than for devices in general.
This is not to say that speed to market as well as safety and effectiveness would not benefit from an alternative set of regulatory standards more attuned to the unique benefits and risks. Rather, these data are suggesting that there isn’t a fire here that needs to be put out with hasty regulatory reforms aimed at improving safety.