Life tables provide information based on the mortality of the population in question. Still, the information can be displayed in various ways that are more or less intuitive.
Importantly, the IRS life tables differ significantly depending on whether they are to be used in the context of qualified retirement arrangements, for example, to calculate the required minimum IRA distribution, or are constructed and used for actuarial purposes, namely to value annuities, life estates, remainders, and reversions.
Despite the very significant differences in female and male life expectancy, the IRS ignores these. Therefore, the IRS life tables aim to represent an amalgamated male-female ‘person’ life expectancy. We will show how the current IRS Life Table 2010CM systematically overestimates male life expectancy more than intended because of changes in the population's life expectancy.
The Mortality Table 2010CM and IRS Uniform Life Tables
2010CM
Let us first turn to the mortality Table 2010CM. It derived from mortality experience around 2010 and applies to valuation dates of June 1, 2023, and thereafter. It is the basis for all of the factors in various actuarial tables, for example, those used for calculating the remainder interest in a charitable remainder trust (1,2).
The data are not in the form of a mortality risk but given as a survival probability at each year of age denoted by lx. This is not intuitive and prevents comparison with other tables( See Figure 1). We are used to seeing the average remaining life expectancy at age x (ex). The IRS uses lx to calculate the remainder factors. How this is done is in the Regulations (3).

Figure 1. Partial view of Table 2010CM.
Survival probability lx can be converted into average life expectancy (4), and the author has recalculated the IRS 2010CM to allow comparisons with other IRS tables and tables of the Social Security Administration. A link to the spreadsheet with the conversion process and formulas is available for inspection and download (5). Ultimately, all of these tables are derived from census data.
IRS Uniform Life Table for RMDs
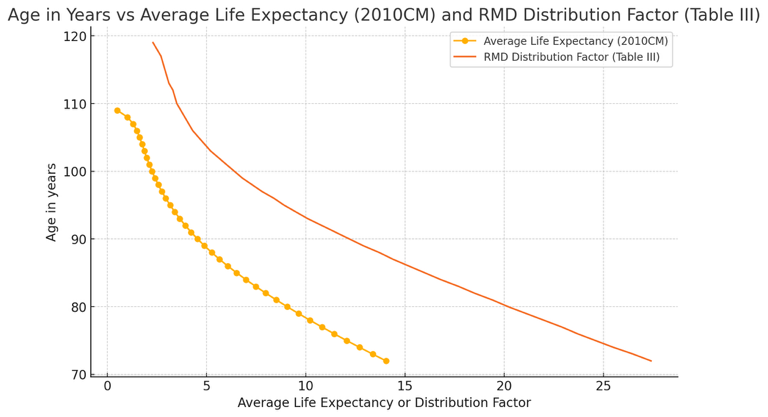
The Uniform Life Table (Table III) is a bit of a misnomer because it does not give average life expectancy but lists a distribution factor for IRA-required minimum distributions (RMDs) (6). Table III (Figure 2) applies to all unmarried IRA owners calculating their own withdrawals, married owners whose spouses aren’t more than 10 years younger, and married owners whose spouses aren’t the sole beneficiaries of their IRAs. The RMD for a retirement account is obtained by dividing the retirement account's current value by the distribution period factor based on your current age. The process is repeated every year. The distribution period factor is related to the average life expectancy but is much higher (Figure 2). Also note that Table III goes to age 120 years, while 2010 CM stops at age 110 years.

Figure 2. Average Life Expectancy according to 2010CM versus distribution factor (graph stops at age 72)
Given that the distribution factor significantly exceeds the average life expectancy, on average, distributions according to the distribution factors will result in a retirement account that is not yet fully distributed at death. This may or may not be what you want for your client.
The Life Table 2010CM is unrealistic, but is it also unfair?
The Life Table 2010CM is a ‘new’ table that went into effect in July 2023 and replaces 2000CM.
2010CM, which informs the IRS actuarial calculations, assigns a single survival probability or average life expectancy to your client regardless of sex assigned at birth. This is unrealistic because of the significant difference in life expectancy between women and men. However, it can still be fair if the ‘person’ life expectancy is an average of the two.
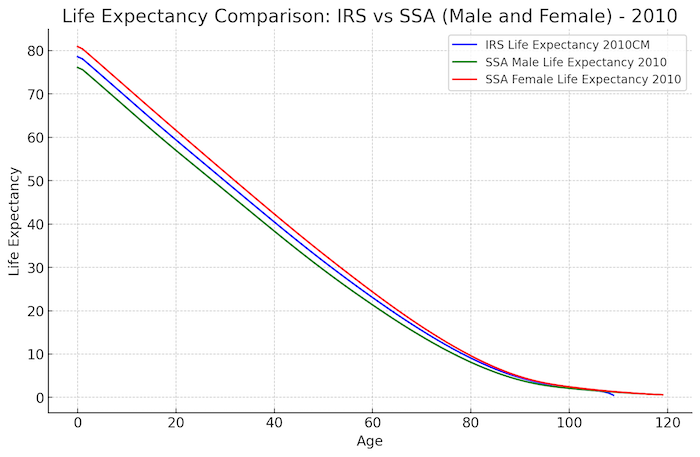
Let us examine this more closely. Table 2010CM is based on 2010 census data, and so are the 2010 tables of the Social Security Administration, which differentiate between men and women. Let’s look at this in a graph (Figure 3).

Figure 3: The IRS 2010CM is in the middle between male and female life expectancies as determined in 2010
As you can see, the curve for the IRS 2010CM is right in the middle between the female and male life expectancy in 2010.
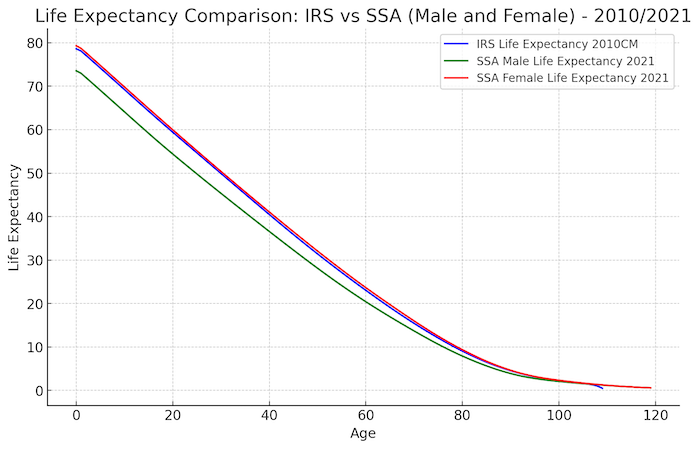
A lot has happened since 2010, and indeed, the most recently available life expectancy data, as used by the SSA, reveal a downward shift in the average male and female life expectancy. The IRS ‘person’ life expectancy currently used (2010CM) is virtually indistinguishable from the SSA female life expectancy in 2021. In the graph (Figure 4), the superposition of blue (IRS 2010CM) and red (SSA Female Life Expectancy 2021) results in a purple curve.

Figure 4: Currently, the IRS 2010CM curve is no longer in the middle but is overlying the SSA 2021 curve of the female life expectancy.
Section 7520(c)(2) directs the Secretary to revise the tables prescribed under section 7520 not less frequently than once every 10 years to reflect the most recent mortality experience available at the time of the revision (7).
Since the most recent revision (Table 2010CM) only went into effect on June 1, 2023, don’t expect any updates soon.
The IRS 2010CM life table equates male life expectancy with female life expectancy. What are the consequences?
Let’s take the example of a Charitable Remainder Trust (8). Charitable Remainder Trusts are a popular estate planning tool that provides income to a non-charitable beneficiary for life or a term of years, with the remainder interest eventually going to a charitable organization. The impact of overestimated male life expectancy on CRTs is multifaceted:
- Valuation of Income Interest: If a CRT’s income beneficiary is male and his life expectancy is overestimated, the value of the income interest is calculated to be higher than it should be. This is because the expected duration of the income payments is assumed to be longer.
- Valuation of Charitable Remainder Interest: Conversely, the value of the charitable remainder interest will be undervalued. This is because the period until the charitable organization receives the remainder is assumed to be longer, reducing the present value of that interest.
- Charitable Deduction: For donors, the charitable deduction allowed for the remainder interest will be lower than it should be since it is based on the present value of the remainder. This can reduce the tax benefits the donor receives from establishing the CRT.
Realistic Longevity Calculators
The life expectancy tables of the IRS and SSA are very simplistic and do not account for health status, smoking history, family history, or socioeconomic factors. The IRS tables do not even account for sex at birth. They have fairly narrow relevance. Your client's most likely life expectancy may differ significantly from those values, leading to estate planning opportunities.
To get a more realistic impression of your client’s life expectancy, there are calculators available that do not require a sign-up, for example, from Northwestern Mutual Insurance (9) and the Society of Actuaries (SOA) (10). The latter will produce tables and graphs showing the likelihood that your client and spouse/partner, if applicable, may live to a certain age. This is in distinction to calculators that give only a single estimated number as life expectancy.
The SOA has commissioned research with detailed tables and visualizations on mortality by socioeconomic category in the United States (11), and a visit to their website is highly recommended.
Conclusion
In estate planning, IRS life tables, such as 2010CM and the Uniform Life Table, are crucial but have significant limitations. They simplify demographic factors by combining male and female life expectancies into one, potentially skewing valuations. For example, overestimating male life expectancy can lead to higher valuations of income interests and lower charitable remainder interests in Charitable Remainder Trusts (CRTs), impacting tax benefits.
These tables overlook individual health, smoking history, family history, and socioeconomic factors. Alternative calculators from sources like Northwestern Mutual and the Society of Actuaries are recommended for more accurate assessments. These tools offer detailed, personalized insights, enhancing the precision and effectiveness of estate planning strategies. Estate planners should use multiple data sources to ensure realistic and beneficial outcomes for their clients.
References
- https://www.irs.gov/retirement-plans/actuarial-tables
- https://www.irs.gov/pub/irs-tege/table-2010cm-final.xlsx
- Regulations 88 FR 37441 https://www.federalregister.gov/d/2023-11837
- How to read and build a mortality table https://fmarthoz.medium.com/how-to-read-and-build-a-mortality-table-a4eb5878abba
- Spreadsheet with IRS 2010CM survival probability to life expectancy conversions https://perma.cc/5MAF-FC8M
- Publication 590-B (2023), Distributions from Individual Retirement Arrangements (IRAs) https://www.irs.gov/publications/p590b
- 26 U.S. Code § 7520 - Valuation tables https://www.law.cornell.edu/uscode/text/26/7520
- Charitable Remainder Trusts: Get Them While They Are Hot This Summer https://natlawreview.com/article/charitable-remainder-trusts-get-them-while-they-are-hot-summer
- Life Span Calculator https://media.nmfn.com/tnetwork/lifespan/index.html#0
- The Actuaries Longevity Calculator https://www.longevityillustrator.org/
-
Mortality by Socioeconomic Category in the United States https://www.soa.org/resources/research-reports/2020/us-mort-rate-socioeconomic/
A podcast that summarized the points of this article is available here:
This is part 2 of the series “Quantitative Estate Planning”


 />i
/>i

