It continues to get safer to drive a vehicle in the United States. Unfortunately, it is more dangerous than ever to be in and around those safely driven vehicles. The National Highway Traffic Safety Administration released its latest Traffic Safety Facts Research Note titled 2018 Fatal Motor Vehicle Crashes: Overview. The data shows a continuation of a long term trend in the reduction of driving fatalities. Since 1975 the number of Fatalities had dropped by almost 22%. This has happened even though the number of miles driven has continued to increase. As a result, the fatality rate per vehicle miles traveled (VMT) has dropped from 3.35 to 1.13. In other words, we are driving more, and dying less.
Such success is due to a number of factors according to NHTSA. First, safety programs both nationally and locally have increased seat belt use the past 40 years while also reducing impaired driving. Second, vehicles are safer with more safety features. Such success suggests that the fatality numbers should continue to trend lower as more vehicles get more standard safety features. Maybe more importantly though, reducing alcohol-impaired driving fatalities would really reduce these numbers. Such deaths account for 29% of these fatalities. This kind of statistic suggests that the current push for a national law requiring new vehicles to have alcohol detectors might save more lives than any other new safety feature.
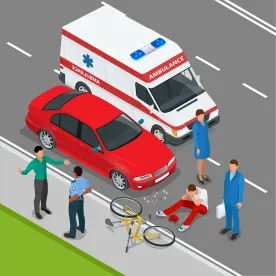
The news is not nearly as good for people outside the vehicle. Fatalities of nonoccupants of vehicles (pedestrians and bicyclists) increased to 30 year highs. In fact, in just the last 10 years, such deaths increased from 14 to 20% of all fatalities studied by NHTSA. Somewhat also troubling was the number of large-truck occupant fatalities. While they jumped less than 1% from the prior year, they were still the highest that they have been in 20 years. So, while passenger vehicles are getting safer, other areas of the automotive industry are not.
Another interesting metric NHTSA looked at was urban versus rural fatalities. These have been trending in opposite directions for the past 10 years. Where rural areas used to be much more dangerous, now it is urban areas. Some of this is expected – the number of urban VMT has increased by 14% in the past 10 years. But what is surprising is the fatality rate per 100 million VMT. In urban areas, that rate has increased by 18% while in rural areas it has decreased by 14%. Urban areas sure sound more dangerous than they used to be. That appears to be principally due to a 69% increase in pedestrian deaths in urban areas the past 10 years and a 48 % increase in bicycle riding deaths.
These last couple of statistics lead to a major question: why? Why are people walking and biking in urban areas dying in vehicle crashes so much more than they used to? One reason might be that the current urban infrastructure is simply not built to have pedestrians, bicyclists and vehicles using the same lanes of traffic. There are few bike lanes, few modern cross walks designed for safety, and it feels like everyone walking has their eyes on a phone, not the street. Now cities are rushing to add scooters. Thus, on any given street, there might be four different modes of transportation, traveling at four very different speeds, trying to occupy the same limited space without any lane demarcations, appropriate signage or traffic signals.
Driving is becoming safer, and has for some time. There is little reason to think that this trend will end. But receiving far less notice is that being in and around those drivers is getting more dangerous. Until urban areas start designing and building infrastructure to help all these travelers live in harmony, the grim truth is that such fatalities should be expected to continue to increase.


 />i
/>i

