State Court 1933 Act Filings
Securities class action filings with 1933 Act claims increased in state courts in 2019 after the 2018 U.S. Supreme Court decision in Cyan Inc. v. Beaver County Employees Retirement Fund. This is one of the more meaningful trends in securities litigation in the last few years. In 2019, filings in state courts with 1933 Act claims exceeded those in federal courts.
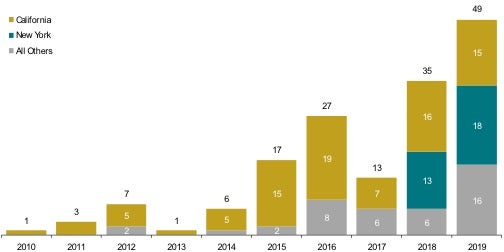
The following data include 1933 Act filings in California, New York, and other state courts. The figure below illustrates all the filings currently in the dataset. Filings from prior years are added retrospectively when identified. In 2019, 15 class actions alleging violations of the 1933 Act were filed in California state courts, 18 were filed in New York state courts, and 16 were filed in other state courts. These filings may include Section 11, Section 12, and Section 15 claims, but do not include Rule 10b-5 claims.
From 2010 through 2019, plaintiffs filed at least 159 1933 Act cases in state courts (state 1933 Act filings).
The number of state 1933 Act filings in 2019 increased by 40 percent from 2018, while the total MDL of state 1933 Act filings rose by 78 percent.
About 45 percent of all state 1933 Act filings in 2019 had a parallel action in federal court.
Figure: State Court 1933 Act Class Action Filings Summary (Dollars in Billions)
While state 1933 Act filings exclusively filed in state courts decreased in California from 2018 to 2019, filings in both New York and other states rose substantially.
In 2019, New York state courts became the preferred state venue for plaintiffs bringing 1933 Act claims.
|
|
2018 |
2019 |
|
|
State Court 1933 Act Class Action Filings |
|
|
|
|
Filings in State Courts Only |
5 |
16 |
27 |
|
California |
4 |
8 |
5 |
|
New York |
1 |
5 |
13 |
|
All Other States |
1 |
3 |
9 |
|
Parallel Filings in State and Federal Courts |
7 |
16 |
22 |
|
Total |
12 |
32 |
49 |
|
Maximum Dollar Loss of State Court 1933 Act Filings |
|
|
|
|
MDL of Filings in State Courts Only |
$7.6 |
$4.3 |
$18.7 |
|
California |
$7.2 |
$2.8 |
$0.8 |
|
New York |
$0.2 |
$1.5 |
$12.9 |
|
All Other States |
$0.2 |
$0.0 |
$5.0 |
|
MDL of Filings in State and Federal Courts |
$7.7 |
$19.4 |
$25.7 |
|
Total MDL |
$15.2 |
$23.7 |
$44.4 |
Note:
1. Filings in state courts may have parallel cases filed in federal courts. When parallel cases are filed in different years, the earlier filing is reflected in the figure above. Filings against the same company brought in different states without a filing brought in federal court are counted as unique state filings.
2. Beginning in 2018, the Securities Class Action Clearinghouse began tracking 1933 Act filings in California state courts containing Section 11 or Section 12 claims; there were six filings in California state courts with only Section 12 claims in 2018. Filings in other state courts are currently only those with Section 11 claims.
3. Figures may not sum due to rounding.
Number of Federal and State Filings
Plaintiffs filed 428 new securities class actions across federal and state courts, the highest number on record and nearly double the 1997–2018 average.
The 160 M&A filings in 2019 were the third-largest number since 2009 (when this report began separately identifying these filings).
Core filings—those excluding M&A filings—were the highest on record, topping even 2008 when filings surged due to the volatility in U.S. and global financial markets. See Appendix 1 for litigation totals from 1997 to 2019.
The growth in core federal filings over the last seven years has coincided with the activity of three plaintiff law firms that have increasingly been involved in securities class actions.
There were just three initial coin offering (ICO)/cryptocurrency-related filings in 2019. Emerging as a new trend were filings against issuers involved in the cannabis industry—13 such federal filings occurred in 2019, up from six in 2018.
The number of class action filings across federal and state venues was the highest on record as overall filing activity remained significantly above pre-2016 levels.
Class Action Filings Index® (CAF Index®) Annual Number of Class Action Filings 2005–2019

Note: This figure begins including state 1933 Act filings in the annual counts in 2010. Parallel class actions are only reflected as a single filing.
The pace of core filings was essentially unchanged in the second half of 2019, while the pace of M&A filings was higher in the second half of the year.
Filing activity increased by 6 percent in the second half of 2019.
Figure: Class Action Filings Index® (CAF Index®) Semiannual Number of Class Action Filings 2010–2019

Note: This figure begins including state 1933 Act filings in the semiannual counts in 2010. Parallel class actions are only reflected as a single filing.
1933 Act Cases Filed in State Courts
Since 2018, 81 percent of California state filings have involved companies headquartered in California and only 16 percent have involved non-U.S. companies. Conversely, in New York only 10 percent involved companies headquartered in New York and 42 percent involved non-U.S. companies.
- In 2019, filings in New York state courts overtook the number of filings in California state courts.
- State filings in states outside of New York and California almost tripled in 2019, from six filings in 2018 to 16 in 2019. These filings were in Florida, Illinois, Massachusetts, Michigan, Nevada, New Jersey, Pennsylvania, Rhode Island, Tennessee, Texas, and Wisconsin.
State 1933 Act filing activity continued to increase, driven largely by filings in state courts outside of New York and California.
Figure: State 1933 Act Filings By State.

Source: Stanford Law School and Securities Class Action Clearinghouse; Bloomberg Law; Institutional Shareholder Services’ Securities Class Action
Services (ISS’ SCAS)
Note:
1. All others contains filings in Alabama, Arizona, Colorado, Florida, Georgia, Illinois, Iowa, Massachusetts, Michigan, Nevada, New Hampshire, New Jersey, Oregon, Pennsylvania, Rhode Island, Tennessee, Texas, Washington, West Virginia, and Wisconsin.
2. Beginning in 2018, California state filings may contain either Section 11 or Section 12 claims. Of the 16 filings in California in 2018, six filings contained Section 12 claims without also containing Section 11 claims.
1933 Act Cases Filed in State Courts-- Size of Filings
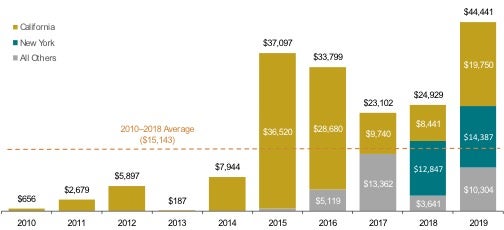
In 2019, MDL for state 1933 Act filings increased to $44.4 billion, almost three times the 2010–2018 average.
California state 1933 Act filings made up nearly 45 percent of the MDL in 2019.
Relative to 2018, MDL for all state 1933 Act filings increased by 78 percent compared to a 40 percent increase in the number of filings.
MDL for California 1933 Act filings accounted for a significant share of MDL at $19.8 billion, or nearly 45 percent. Two companies with MDLs of around $6 billion each largely contributed to this total.
Figure: Maximum Dollar Loss (MDL) of State 1933 Act Filings 2010–2019 (Dollars in Millions)

Source: Stanford Law School and Securities Class Action Clearinghouse; Bloomberg Law; ISS’ SCAS
Note: Beginning in 2018, California state filings may contain either Section 11 or Section 12 claims. Of the 16 filings in California in 2018, six filings contained Section 12 claims without also containing Section 11 claims. MDL calculations include all shares outstanding and not only shares traceable to offering materials. Therefore, these calculations overstate potential damages. MDL associated with filings related to a spin-off or merger-related issuance are excluded.
Dollar Loss on Offered SharesTM in Federal Section 11 - Only Filings and 1933 Act Cases Filed in State Courts
This analysis calculates the loss of market value of class members’ shares offered in securities issuances that are subject to 1933 Act claims. It is calculated as the shares offered at issuance (e.g., in an initial public offering (IPO), a seasoned equity offering (SEO), or a corporate merger or spin-off) acquired by class members multiplied by the difference between the offering price of the shares and their price at the end of the class period.
This alternative measure of losses has been calculated for federal filings involving only Section 11 claims (i.e., no Section 10b claims) and 1933 Act filings in state courts. This measure, Dollar Loss on Offered Shares (DLOS), aims to capture more precisely than MDL the dollar loss associated with the specific shares at issue as alleged in
a complaint.
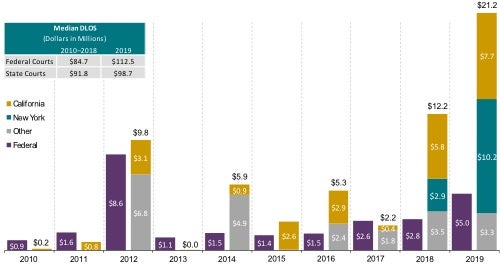
In 2019, the Dollar Loss on Offered Shares across state and federal courts was nearly four times the 2010–2018 average.
DLOS in state courts has exceeded that in federal courts in five of the last six years.
In 2019, state 1933 Act filings had the highest DLOS of the decade, regardless of venue.
Figure: Dollar Loss on Offered Shares™ for Federal Section 11–Only and State 1933 Act Filings 2010–2019 (Dollars in Billions)

Source: Stanford Law School and Securities Class Action Clearinghouse; Bloomberg Law; ISS’ SCAS; CRSP; SEC EDGAR
Note: Federal filings included in this analysis must contain a Section 11 claim and may contain a Section 12 claim, but do not contain Section 10b claims. Beginning in 2018, California state filings may contain either Section 11 or Section 12 claims. Of the 16 filings in California in 2018, six filings contained Section 12 claims without also containing Section 11 claims.
Comparison of Federal Section 11 Filings with State 1933 Act Filings Pre and Post Cyan
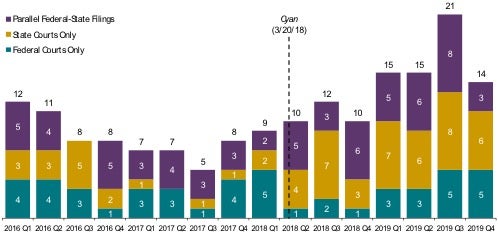
The figure below is a combined measure of Section 11 filing activity in federal courts and 1933 Act filings in state courts. It highlights parallel (or related) class actions in federal and state courts.
- In 2019, the combined number of federal Section 11 filings and state 1933 Act filings was 65. This comprised 22 parallel filings, 27 state-only filings, and 16 federal-only filings.
- Overall, the 59 percent increase in these filings from 2018 can be attributed to increases in each category (i.e., parallel, state-only, and federal-only filings).
The third quarter of 2019 had the largest quarterly number of combined federal Section 11 filings and state 1933 Act filings on record.
While the increase in the aggregate number of federal Section 11 and state 1933 Act filings follows an increase in the number of IPOs (see p. 27), the change in the composition (federal vs. state) shows the effect of the Cyan decision.
State 1933 Act filings have continued to increase since the Cyan decision, although new filing activity lessened in the fourth quarter relative to the peak in the third quarter of 2019.
Figure: Pre-and Post-Cyan Quarterly Federal Section 11 and State 1933 Act Filings 2015-2019.

Source: Stanford Law School and Securities Class Action Clearinghouse; Bloomberg Law; ISS’ SCAS
Note:
1. The federal Section 11 filings displayed may include Rule 10b-5 claims, but state 1933 Act filings do not.
2. Section 11 filings in federal courts may include parallel (or related) cases filed in state courts. When these cases are filed in different quarters, the earliest filing is counted. If filings against the same company are brought in different states in addition to a filing brought in federal court, the parallel filing is counted as a unique case and the state-only filing is treated as a unique case. Filings against the same company brought in different states without a parallel filing brought in federal court are counted as unique state filings.
3. Beginning in 2018, California state filings may contain either Section 11 or Section 12 claims. Of the 16 filings in California in 2018, six filings contained Section 12 claims without also containing Section 11 claims.
Read more: Securities Class Action Filings—2019 Year in Review
Read Key Trends in Federal Filings: An Excerpt from Securities Class Action Filings.
Back to the main page: Securities Class Action Filings.


 />i
/>i

