Welcome to the National Law Review's Client Resource Homepage
 For help with publishing or any other content needs, pleaseContact Our Editorial TeamThis account is monitored by NLR website
|
To see a summary of your content in the National Law Review, click 'My Account' at the top right of this page. |
The National Law Review offers real-time analytics to our publishing partners, and our analytics include readership data on articles, events, author biographies, and organizational profiles. The NLR analytics dashboard is powered by Matomo (formerly Piwik) and offers a number of readership analytics features.
The National Law Review does not require a login to read our articles, so the information captured on readers is not as specific.
Analytics data that can be accessed through the system includes:
-
Pageviews for articles published on the NLR, identified by page title.
-
How readers reached the NLR, including information on internet search, referral by another website, social media, or directly from an NLR newsletter.
-
When readers accessed the articles, with specific information on the reader’s location outlined on a real-time map, actions used on the site, and internet providers used.
-
Outlinks to other sources citing content published on the NLR, including websites and social media sources.
-
Readership data on specific authors, including pageviews of specific author profiles and article sources.
-
A live visitor log, with IP addresses of readers and return visits.
-
Data on the most popular keywords used in search. Google keywords and the location of the reader may be limited by privacy settings on the reader’s computer and in certain areas by privacy laws.
Publishers can also access and generate charts detailing the total number of visits to articles over time, as well as the average visit duration, the total number of outlinks, and the source of website traffic—direct entry v. search engine traffic v. social media v. websites. More information on how to access and use the features detailed above is included in this guide.
The NLR can provide training and demonstrations on analytics functionality and accessibility. Publishers can reach out to our publication specialists to schedule meetings over email, phone, and video.
Publishers can also contact the NLR for assistance through:
-
Emailing articleupdates@natlawreview.com. This address is monitored by NLR website managers and publication specialists 7 days a week from 7 am to 7 pm CST.
-
Reaching out to your account manager
-
Calling 708-357-3317 or toll-free (877) 357-3317 Monday through Friday 7 am to 7 pm CST.
General Analytics Breakdown for Clients
Definitions of site terms:
-
Visits: Number of people visiting your article or page.
-
Page Views: Number of views your article received. This may include repeat visitors.
-
Outlink: The list of external URLs that were clicked by your visitors from your website pages, or, any clicks on URLs that are not on the same domain.
-
Source Page: The specific categories your articles are filed under on the website. For example, Immigration Law or Corporate Law.
-
Keywords: Words typed into Google that help pull your article up.
-
Providers: Different types of internet service providers (ISP) used by readers.
Default Dashboard Layout
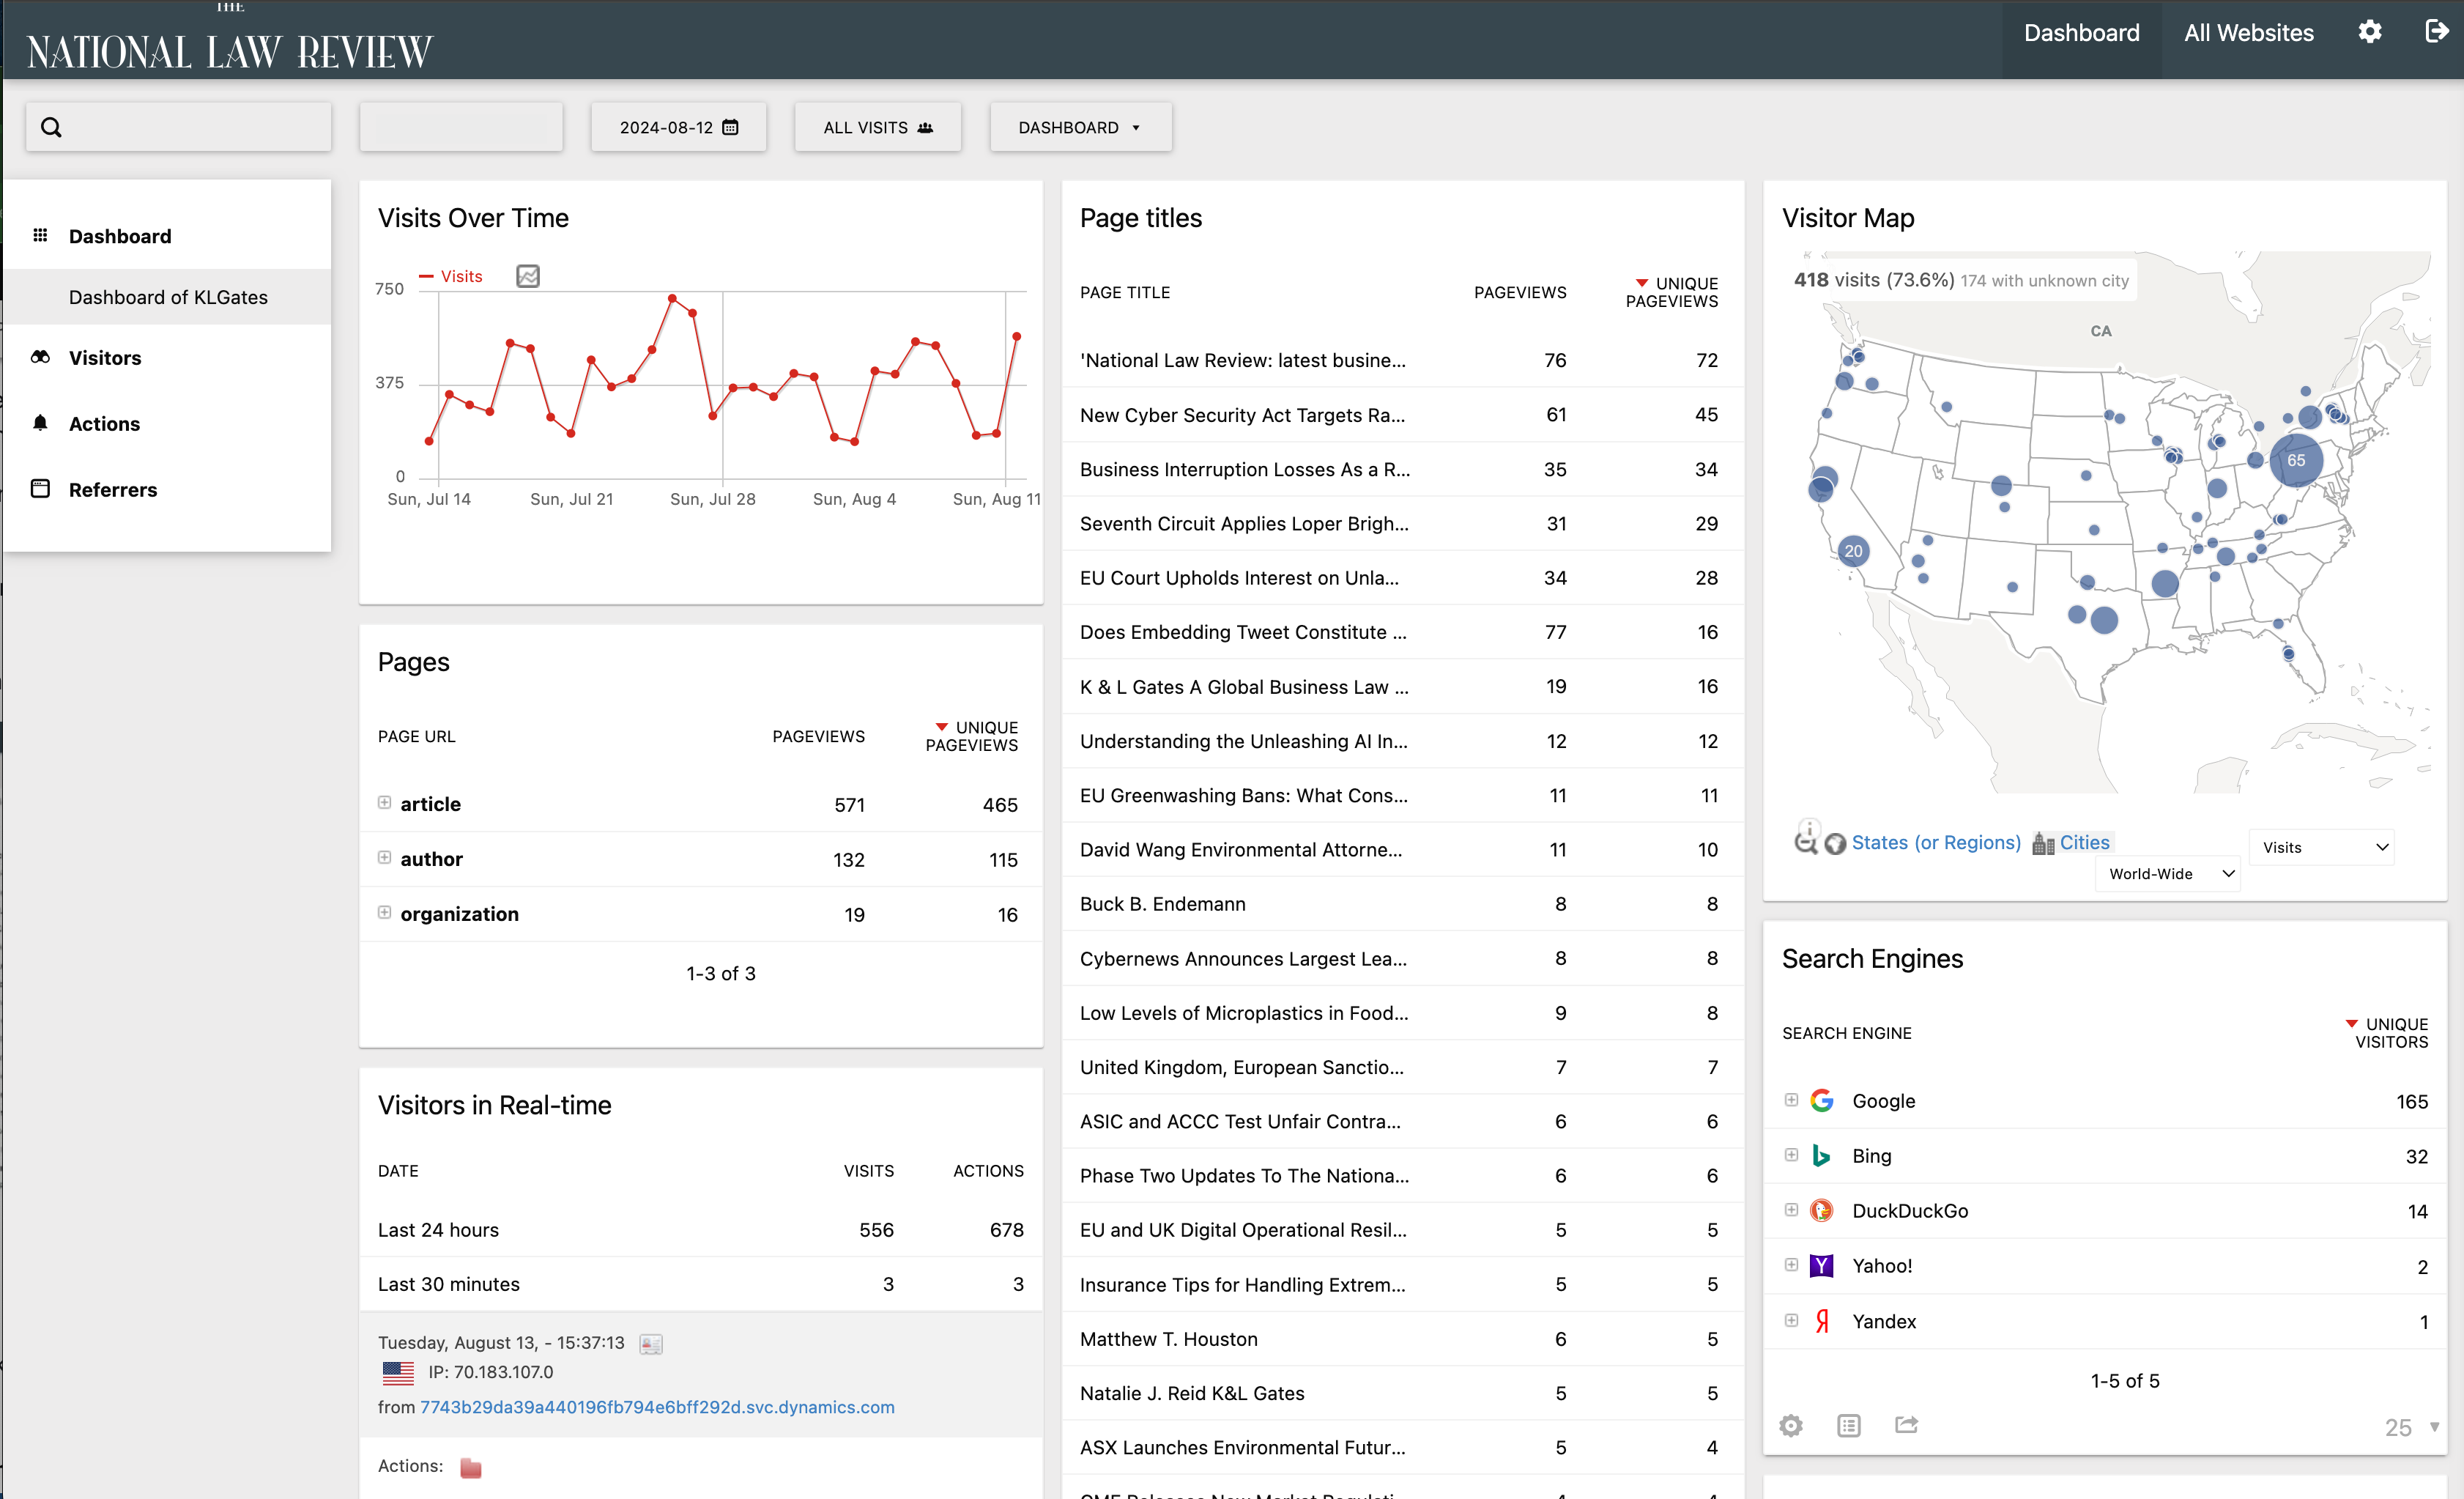
On the left-hand side, there is a box with four categories listed: Dashboard, Visitors, Actions, and Referrers
The dashboard is customizable to your needs; you can add or move any widgets you’d like to have to appear on your dashboard when you log in. To customize your dashboard, on the top row of drop-down buttons, where it says ‘Dashboard,’ on the drop-down and select from the list of widgets.
The visitors section breaks down various ways you can view who is looking at your articles. Please keep in mind that your data will change depending on the date range you select. Make sure to set your dates to show the information you are looking for, the default is the past 24 hours.
-
The overview section shows your visits over time and your general overview.
-
The visitor log will show the IP addresses of the visitors, the articles they looked at, how they got to the article (through which source), the actions taken on the page, as well as the provider, used.
-
The Author, Source, or Other Variables section will break down views by author, article page source or other information.
-
The Locations section will break down visitors from all over the United States and other countries and continents.
-
The Real-Time Map will show visitors in real time on our site.
How to View Your Analytics
-
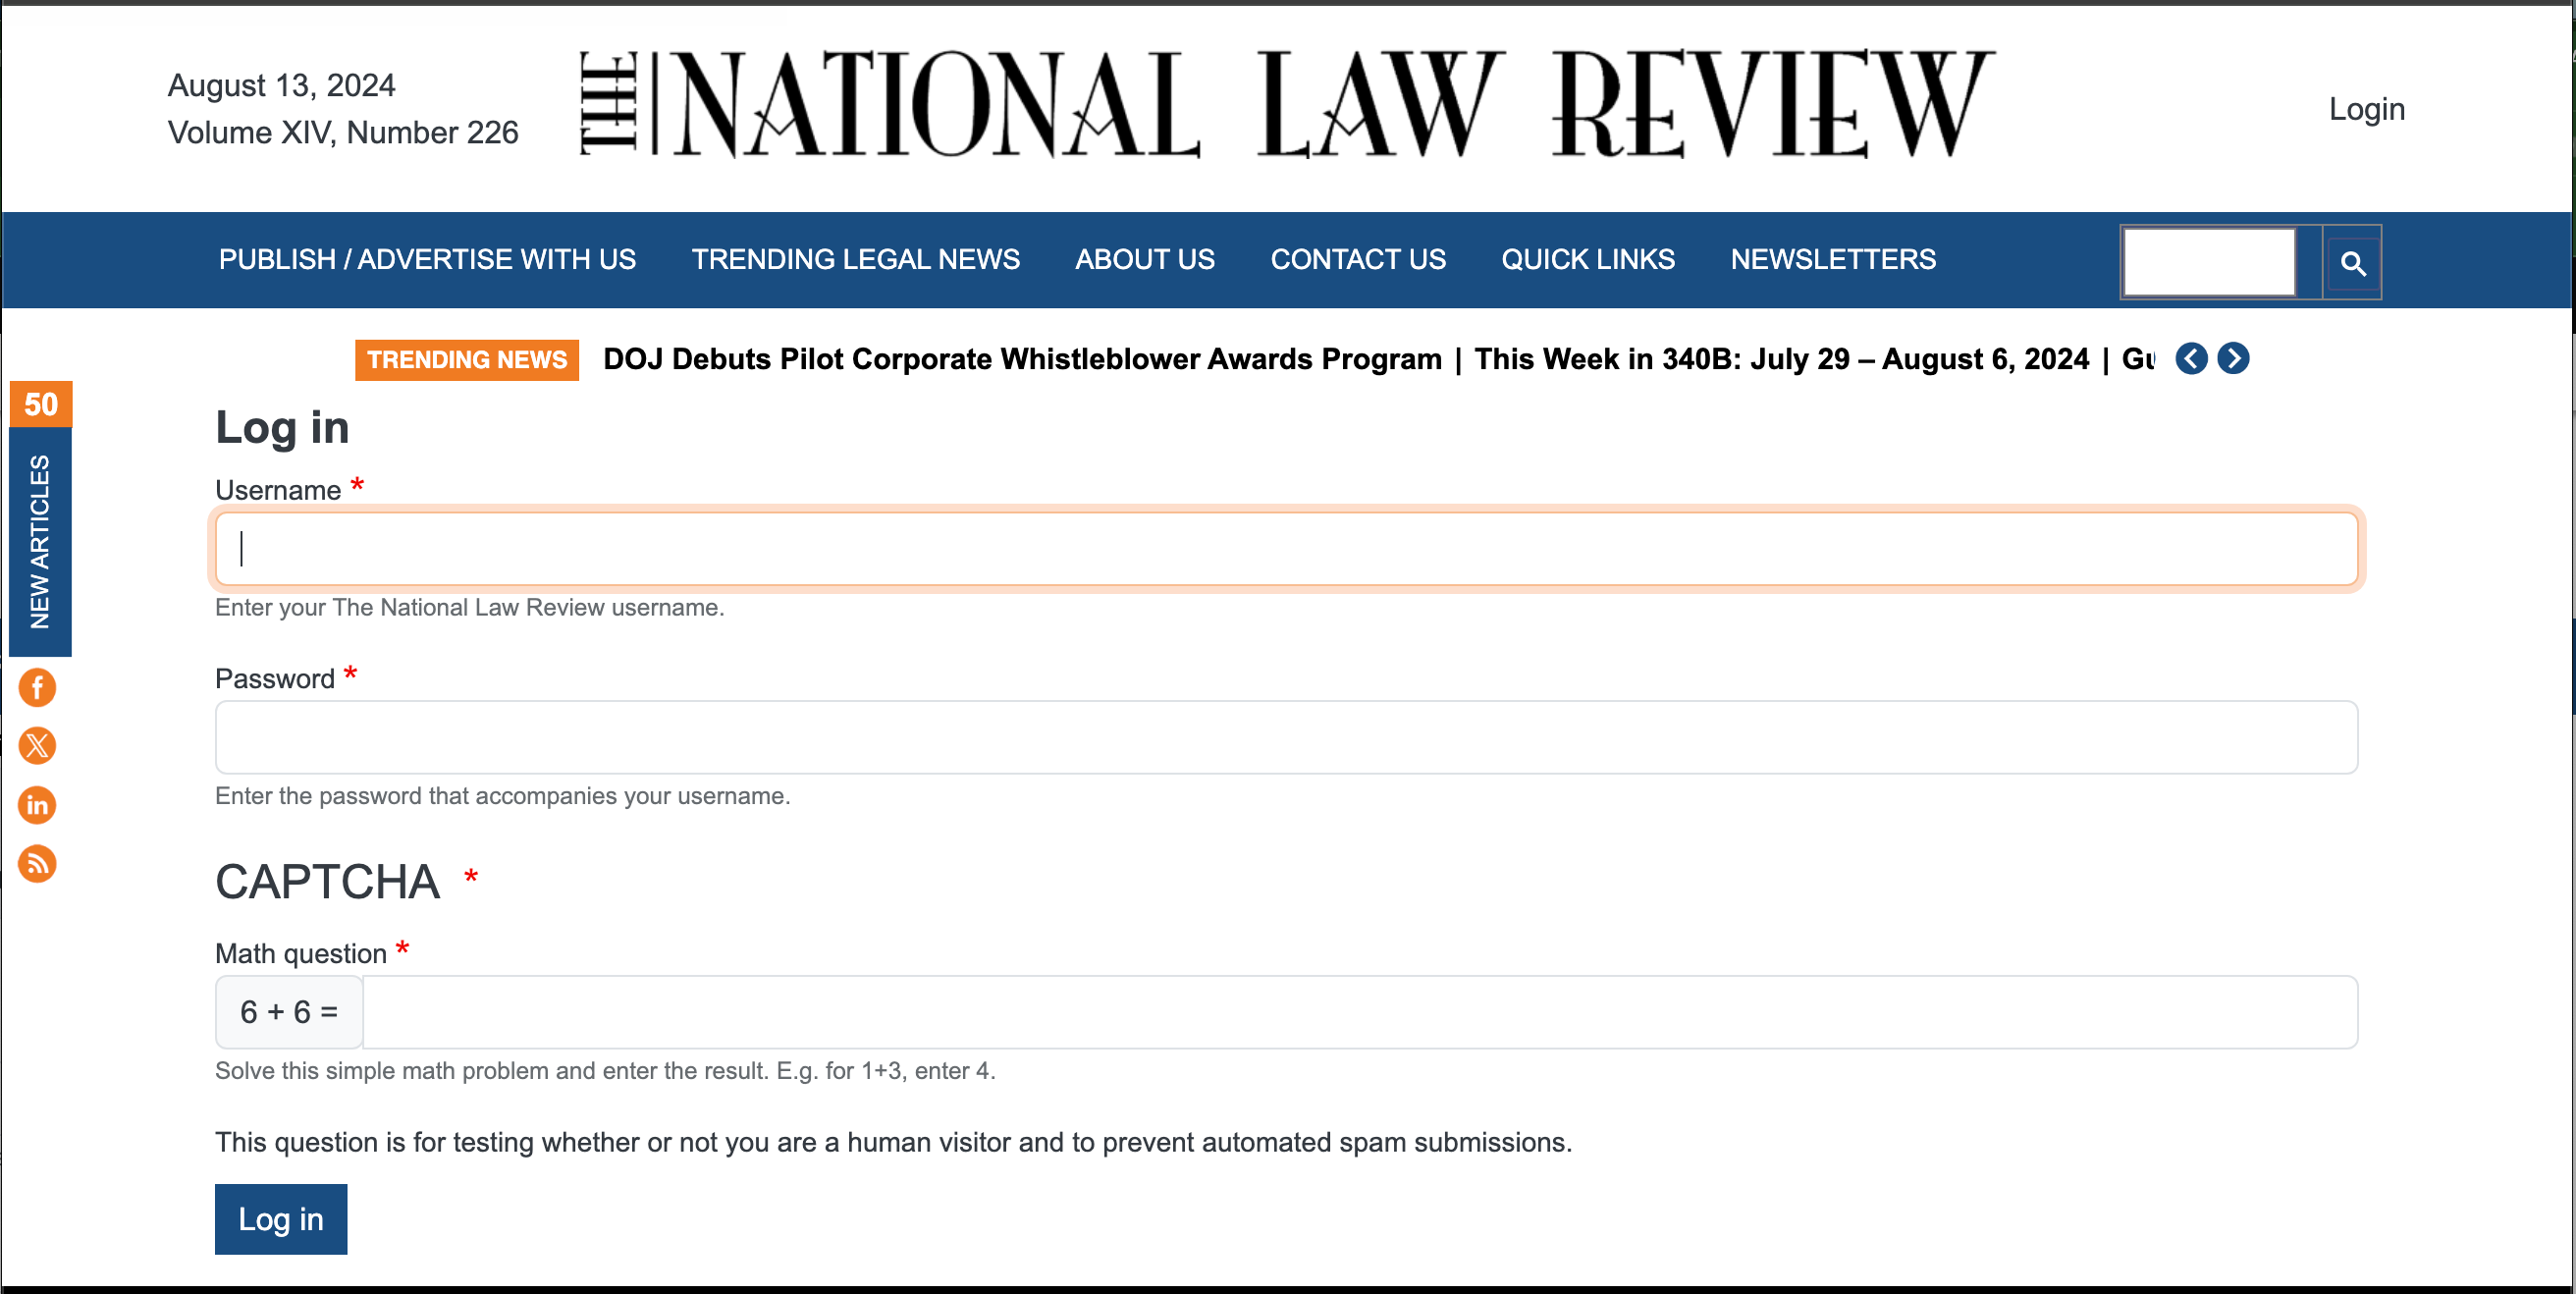
Login to the website. You can find the login link in the top right-hand corner of natlawreview.com.

-
Once logged in, click on the ‘Analytics’ link right next to the login link. Only clients with logins can access our analytics page.

-
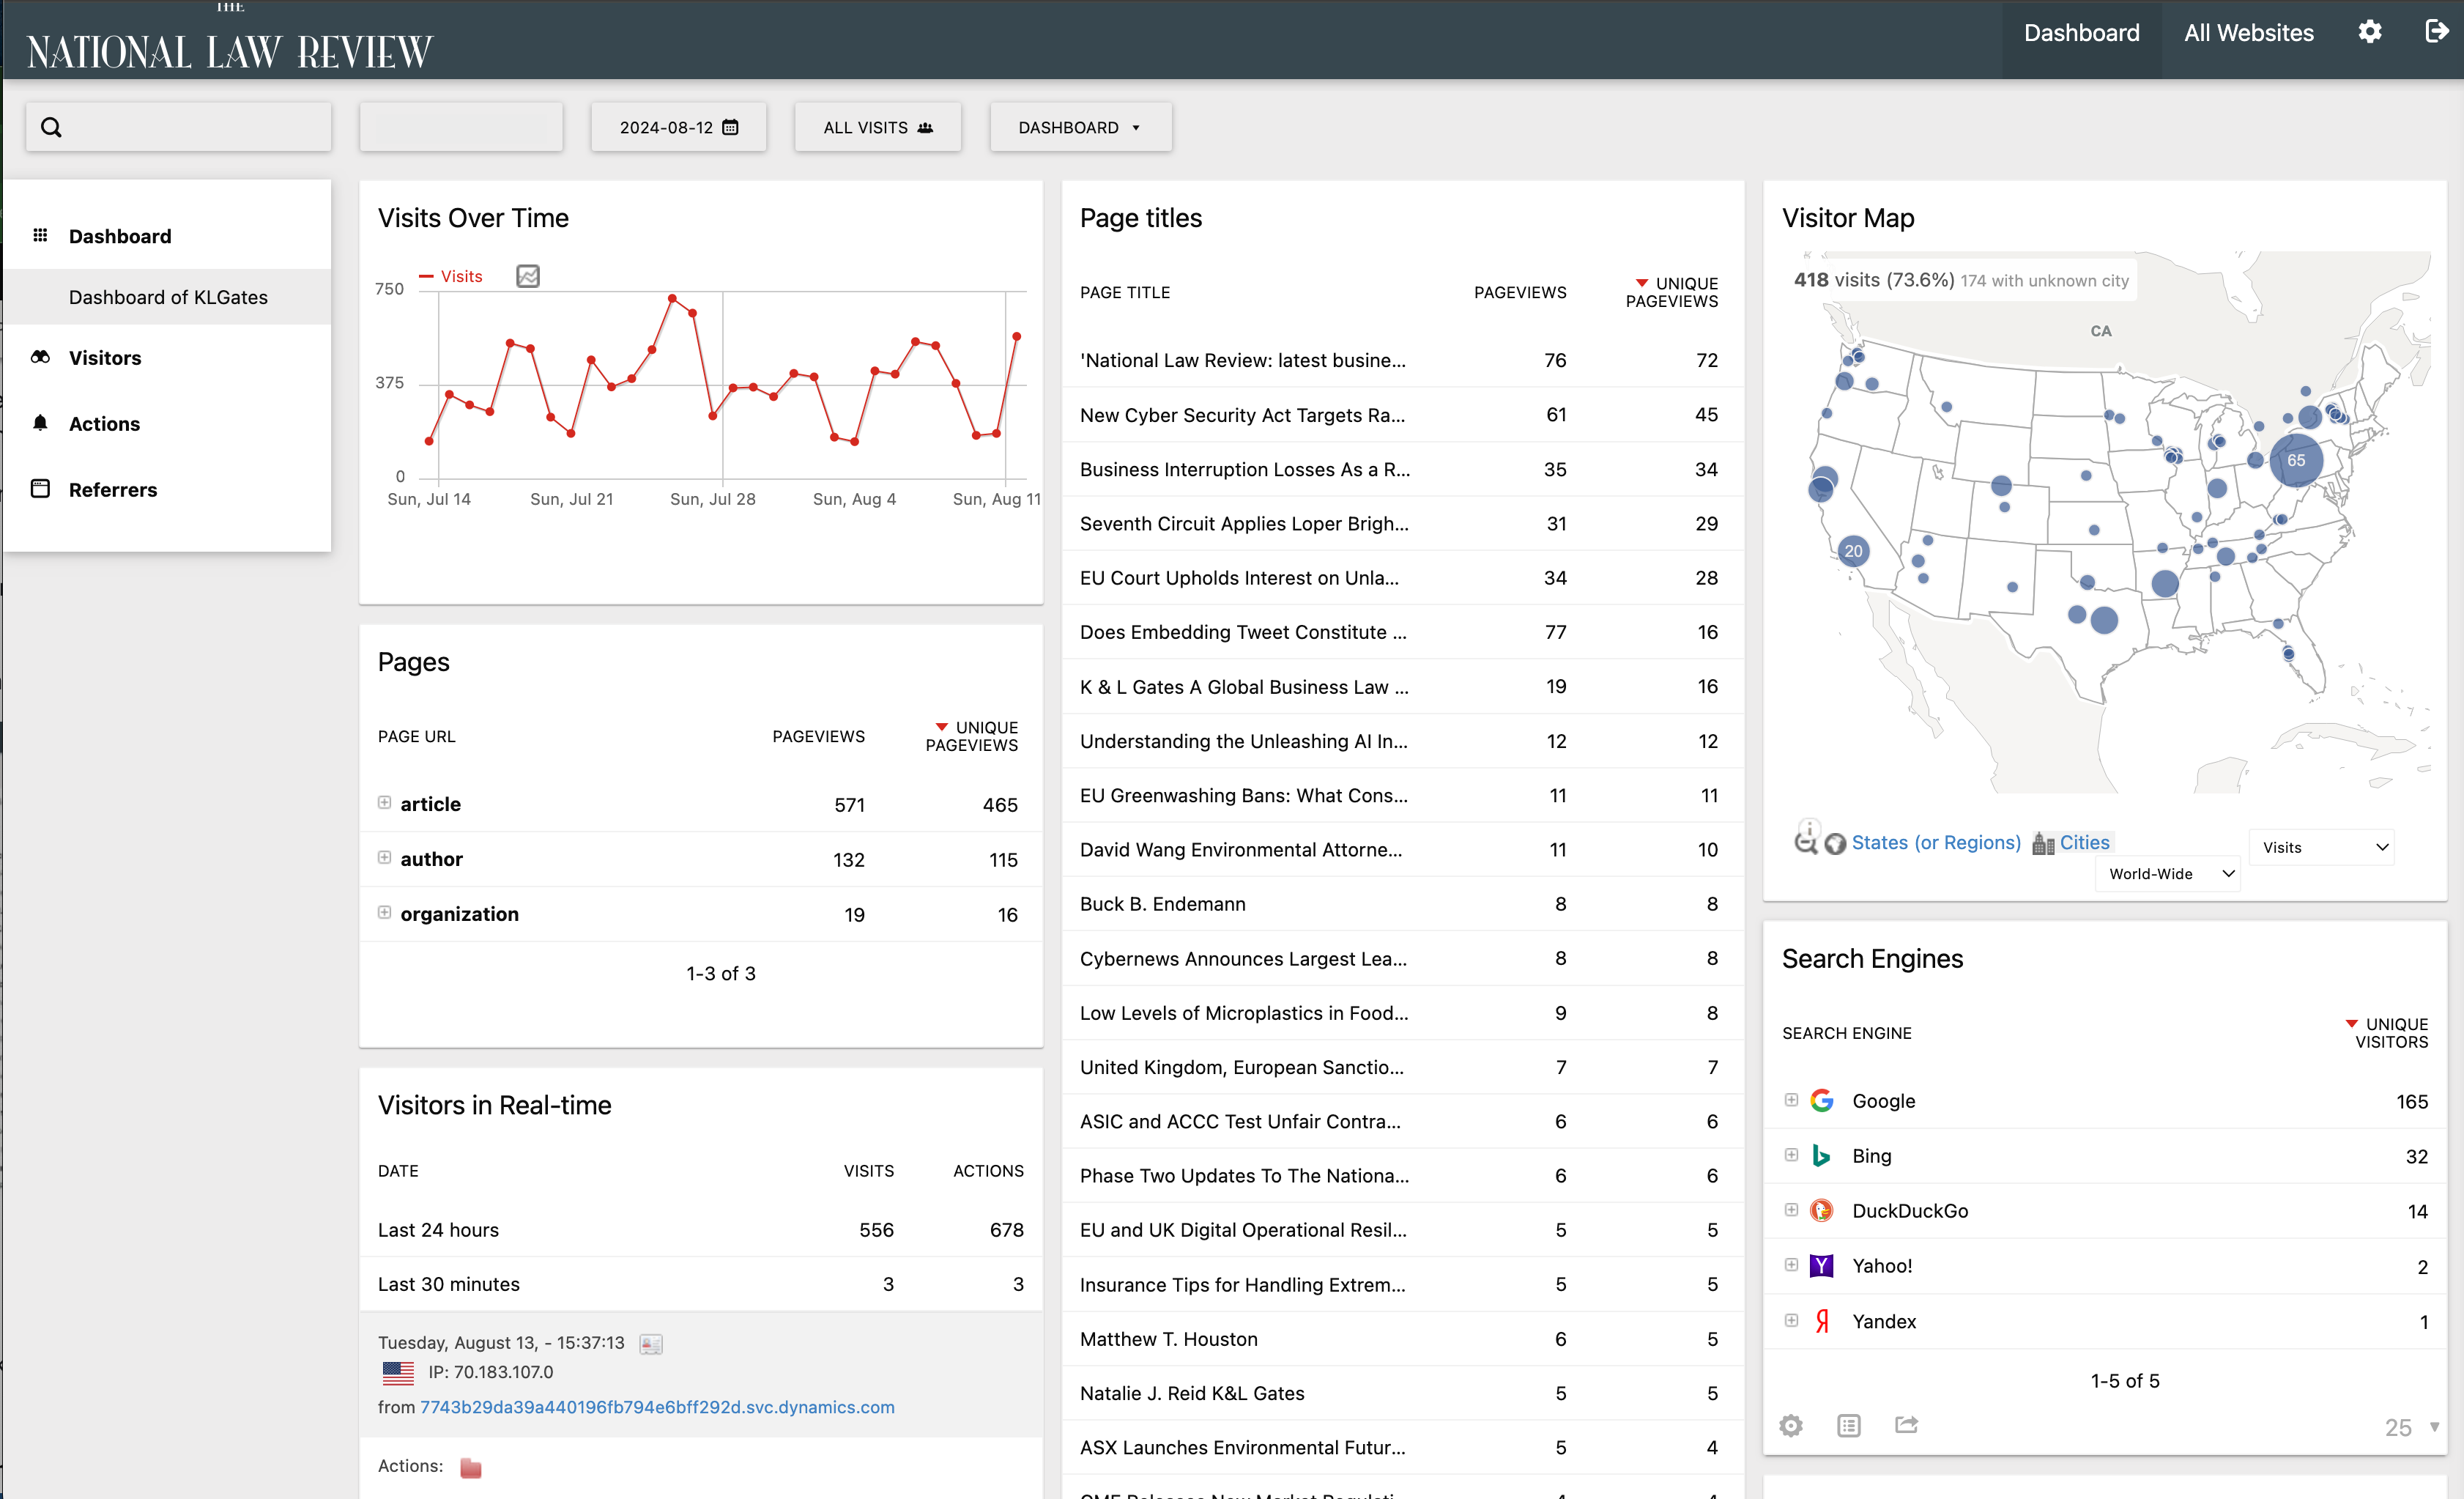
The dashboard will appear; you should be able to view all of your page titles, outlinks, source pages, visitors, actions on article pages, and more.
-
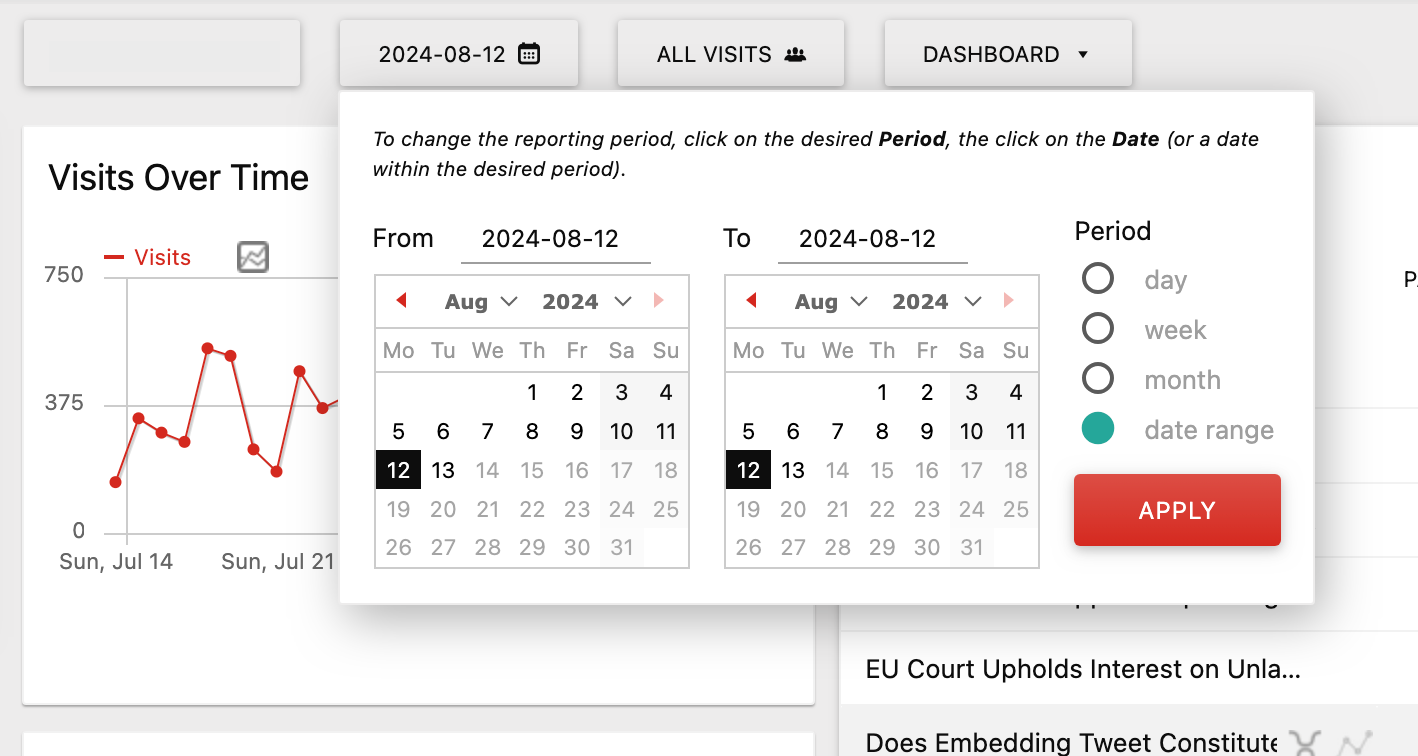
To search by date range click on the ‘From date to date’ on the top center of the dashboard. Here, you can select from certain days, weeks, and months from where you would like to see data. Once selected, click "Apply." The page should load all articles from within the selected date range. On the left-hand side, you can see the outlinks, the visitor map, visits over time, returning visits over time, providers, and states where active readers of your articles are. In the center are all of the articles from the selected date range. On the right-hand side, it will show you articles, sources, and other methods of tracking your data, keywords, and visitors in real-time.
-
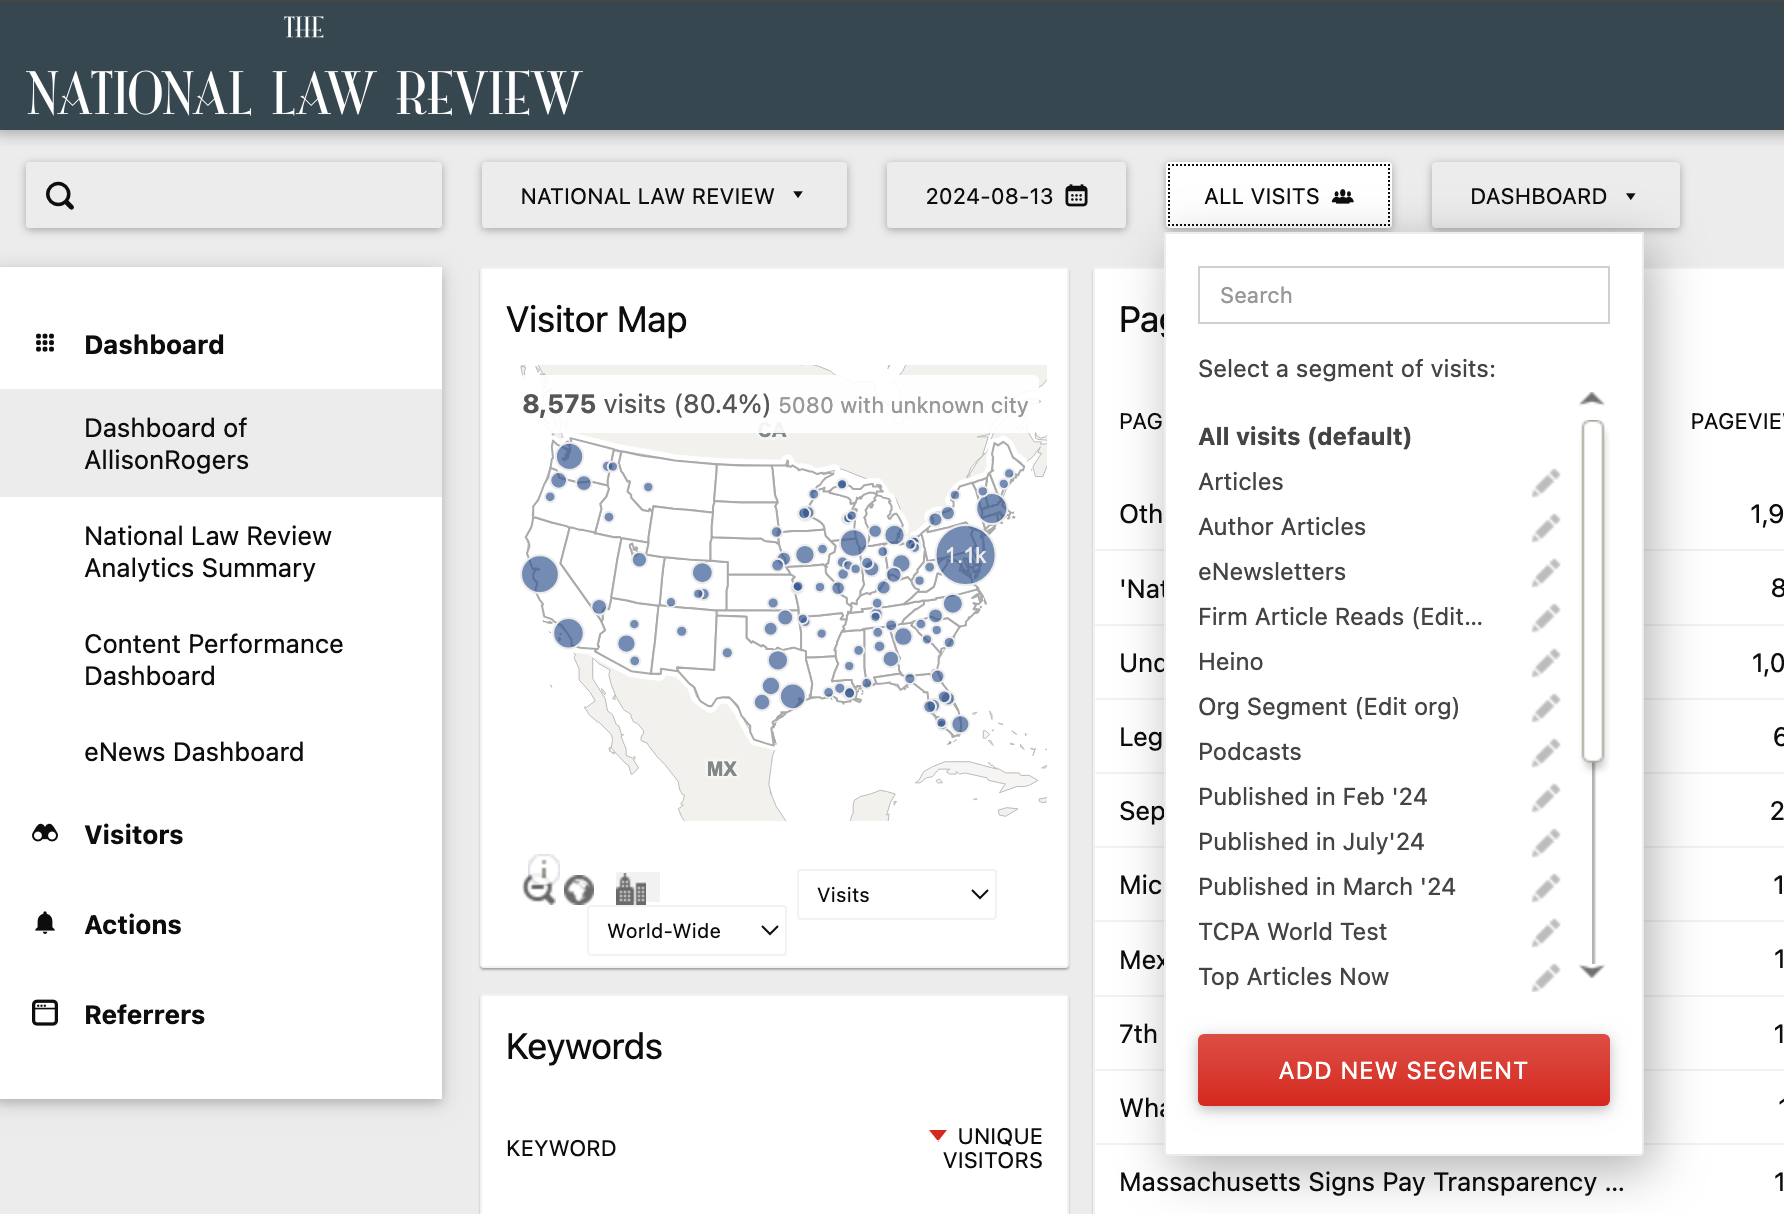
If you want to search by your article sources, next to the date link, there is a link that says ‘All Visits,’ and once you click, a drop-down menu will appear that lists all of your different sources, or sub-categories, of your content. For example, if you wanted to search for all of your Immigration blog articles, simply select that option and select apply. Please reach out to NLR for assistance setting up sources/segments.
-
You can also view a summary of all visits and actions each blog gets. Reset the segment to ‘All Visits’ and the data will display all data from your firm.
-
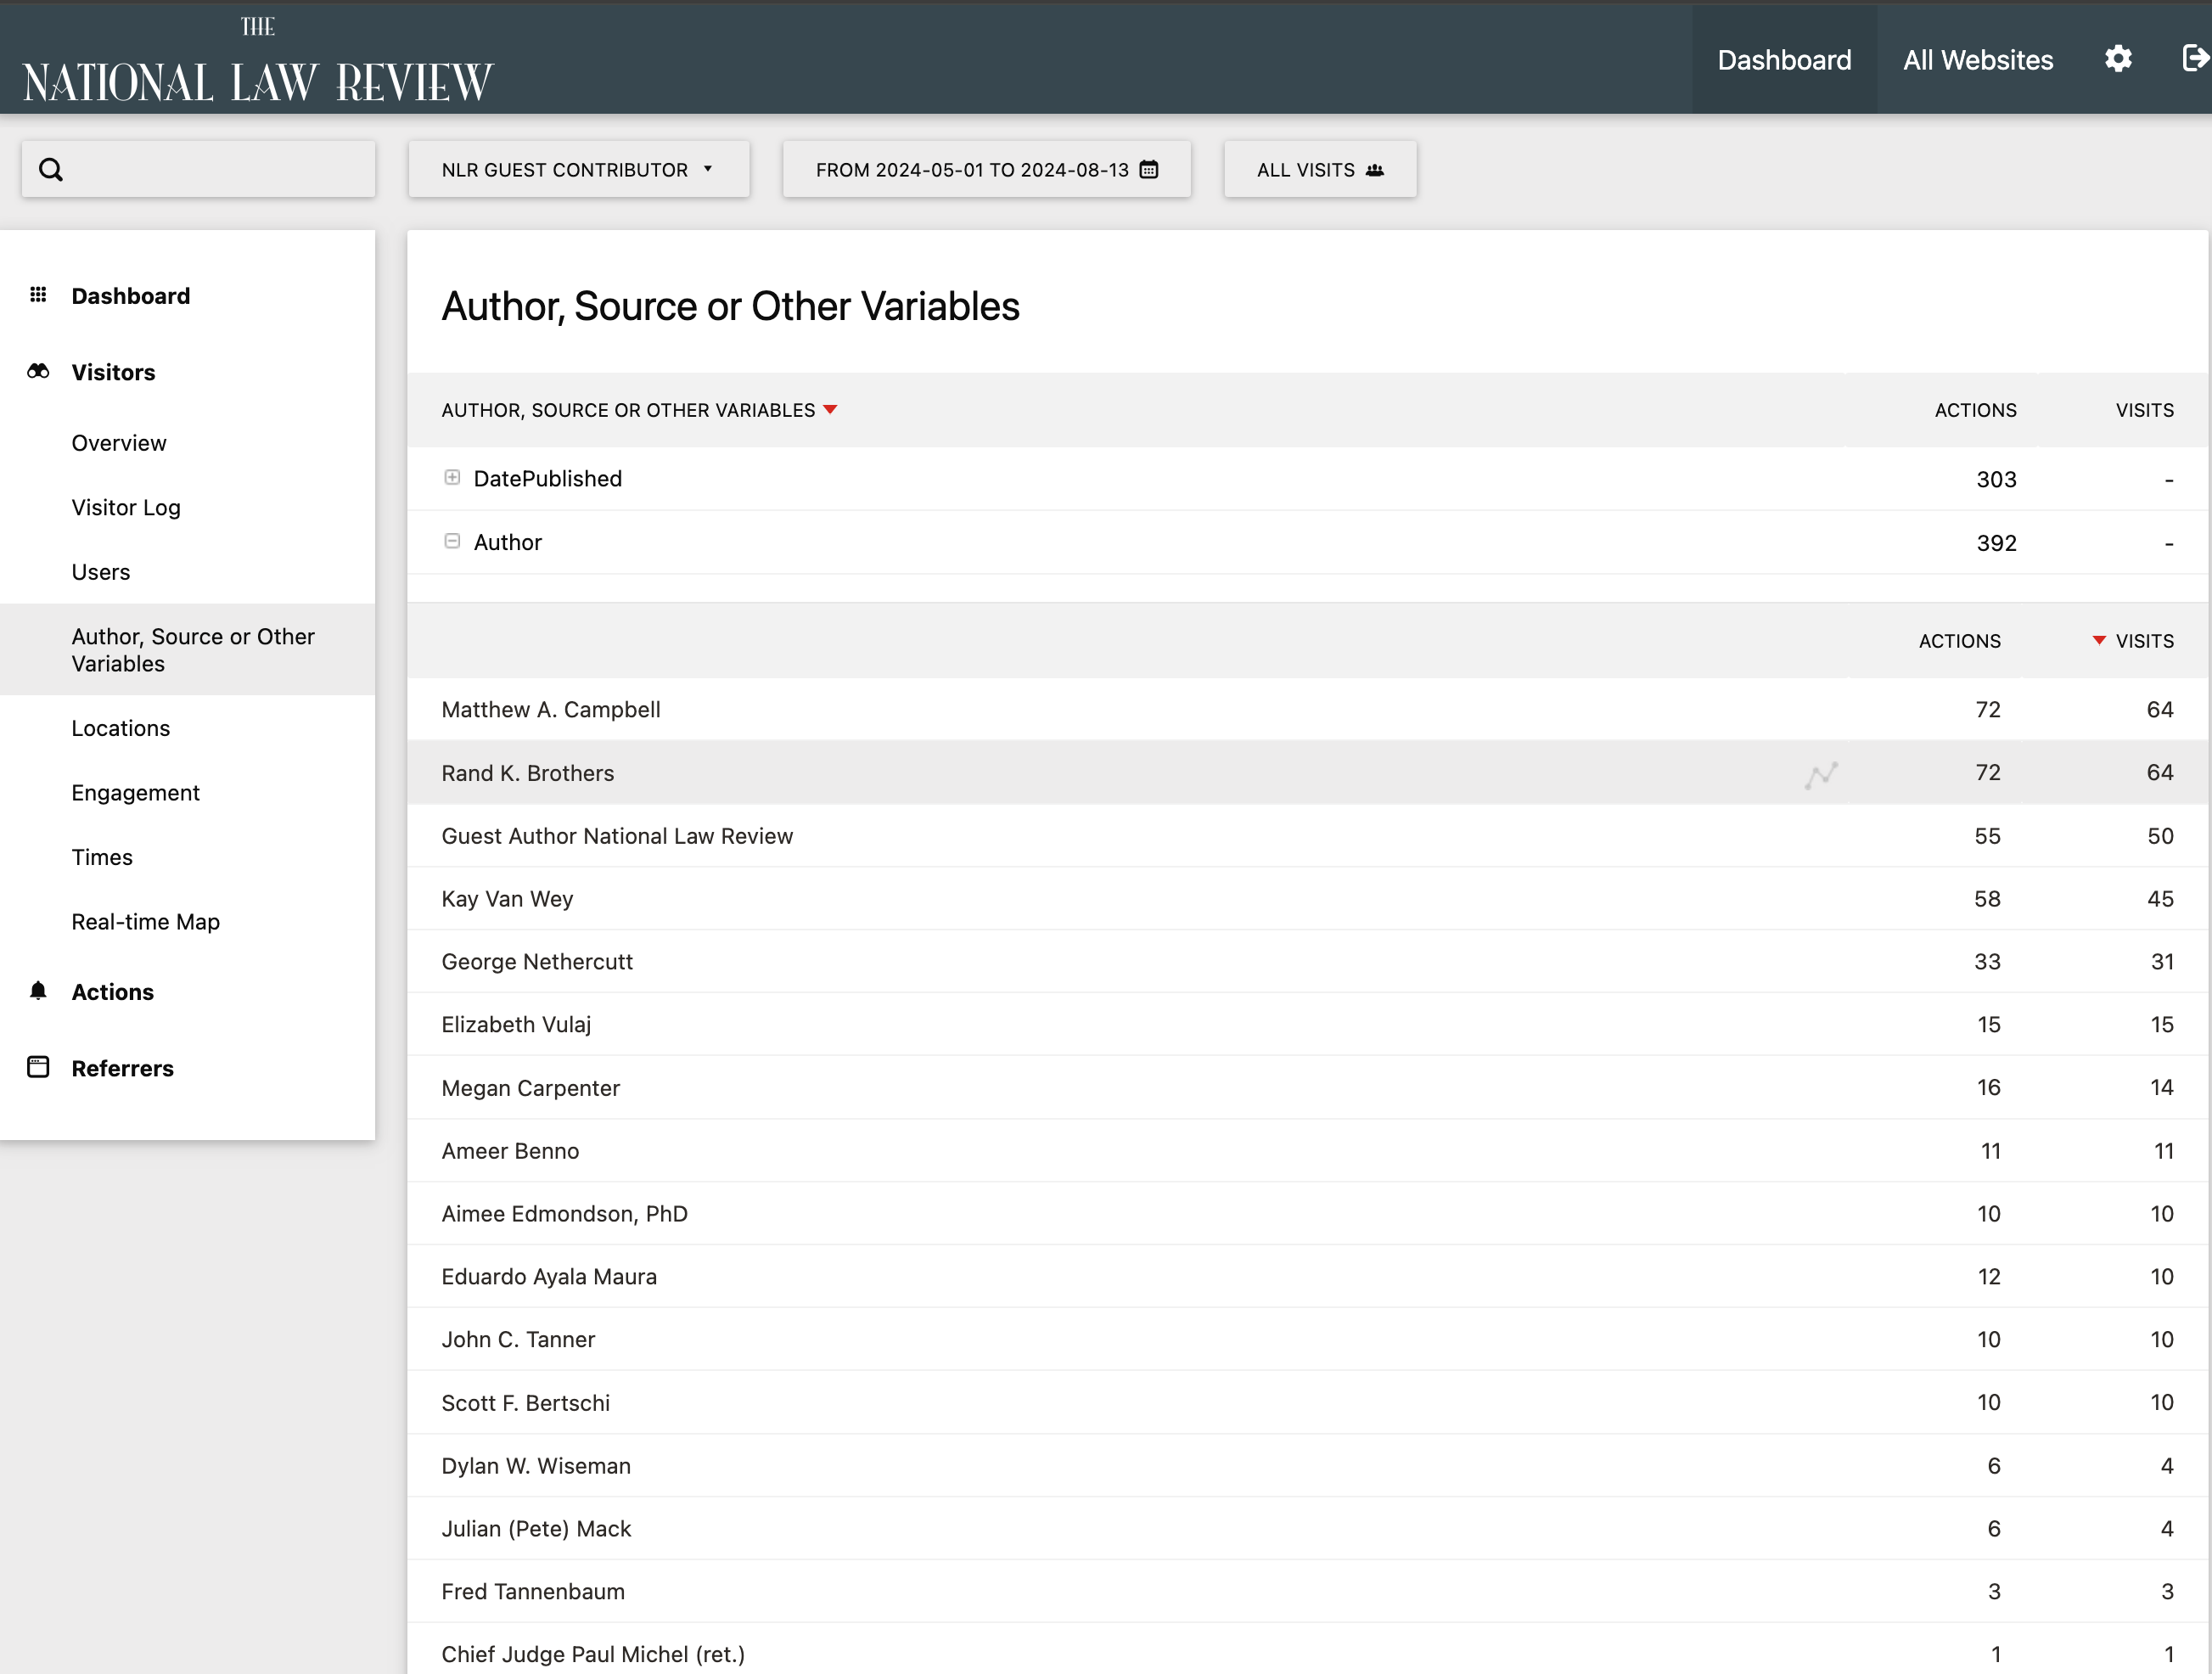
On the left-hand of the screen, if you click on the ‘Visitors’ tab, you can view specifics from visitors who are viewing your articles. If you click on ‘Authors, Source, and Other Variables,’ it will show metrics of the different authors from your firm, the different source pages, and the date published.
-
Click the plus icon [+] to open a list of your Authors, Sources, or Articles by Date.
How to View Transitions: Where Visitors Come From and Where They Go
TRANSITIONS
-
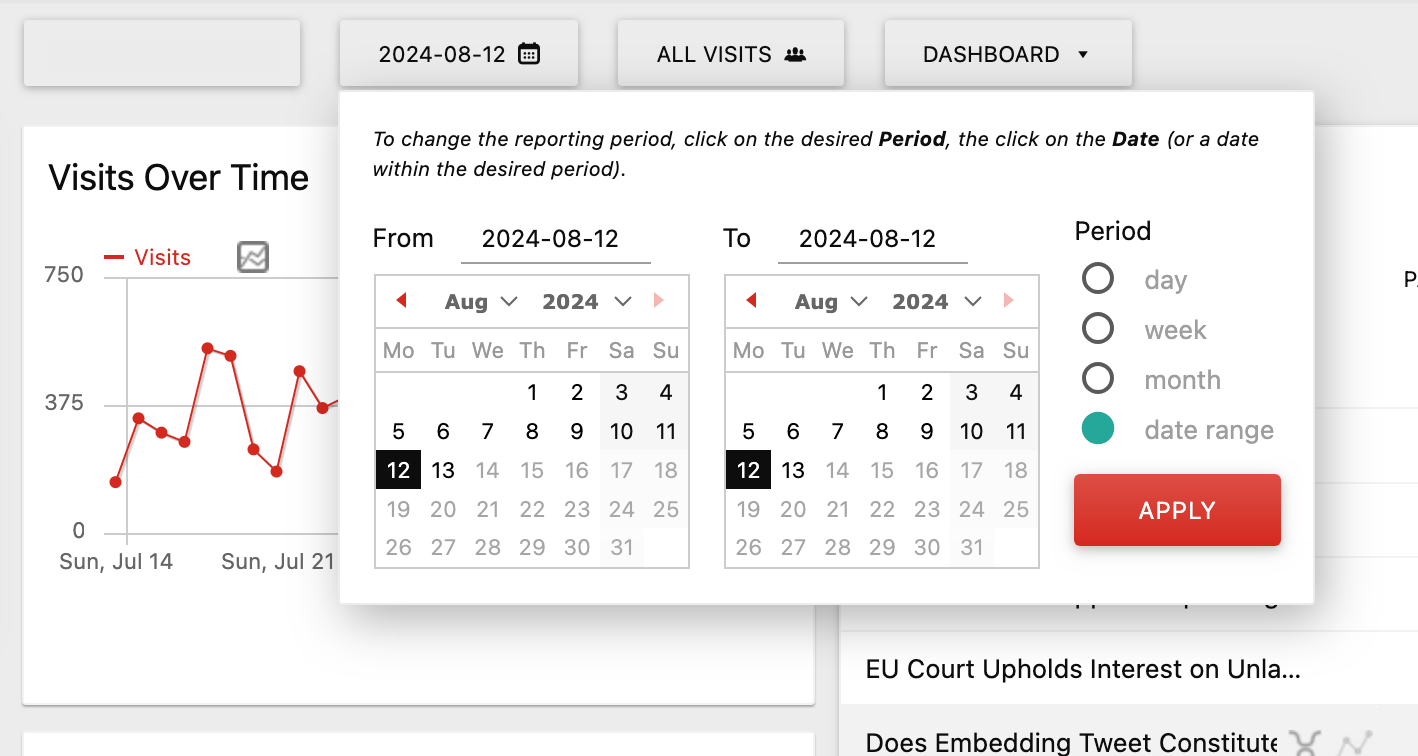
In the Dashboard, On the top bar, there is a calendar. Click on this and change the date range to your desired date range. The default range is the past 24 hours.
-
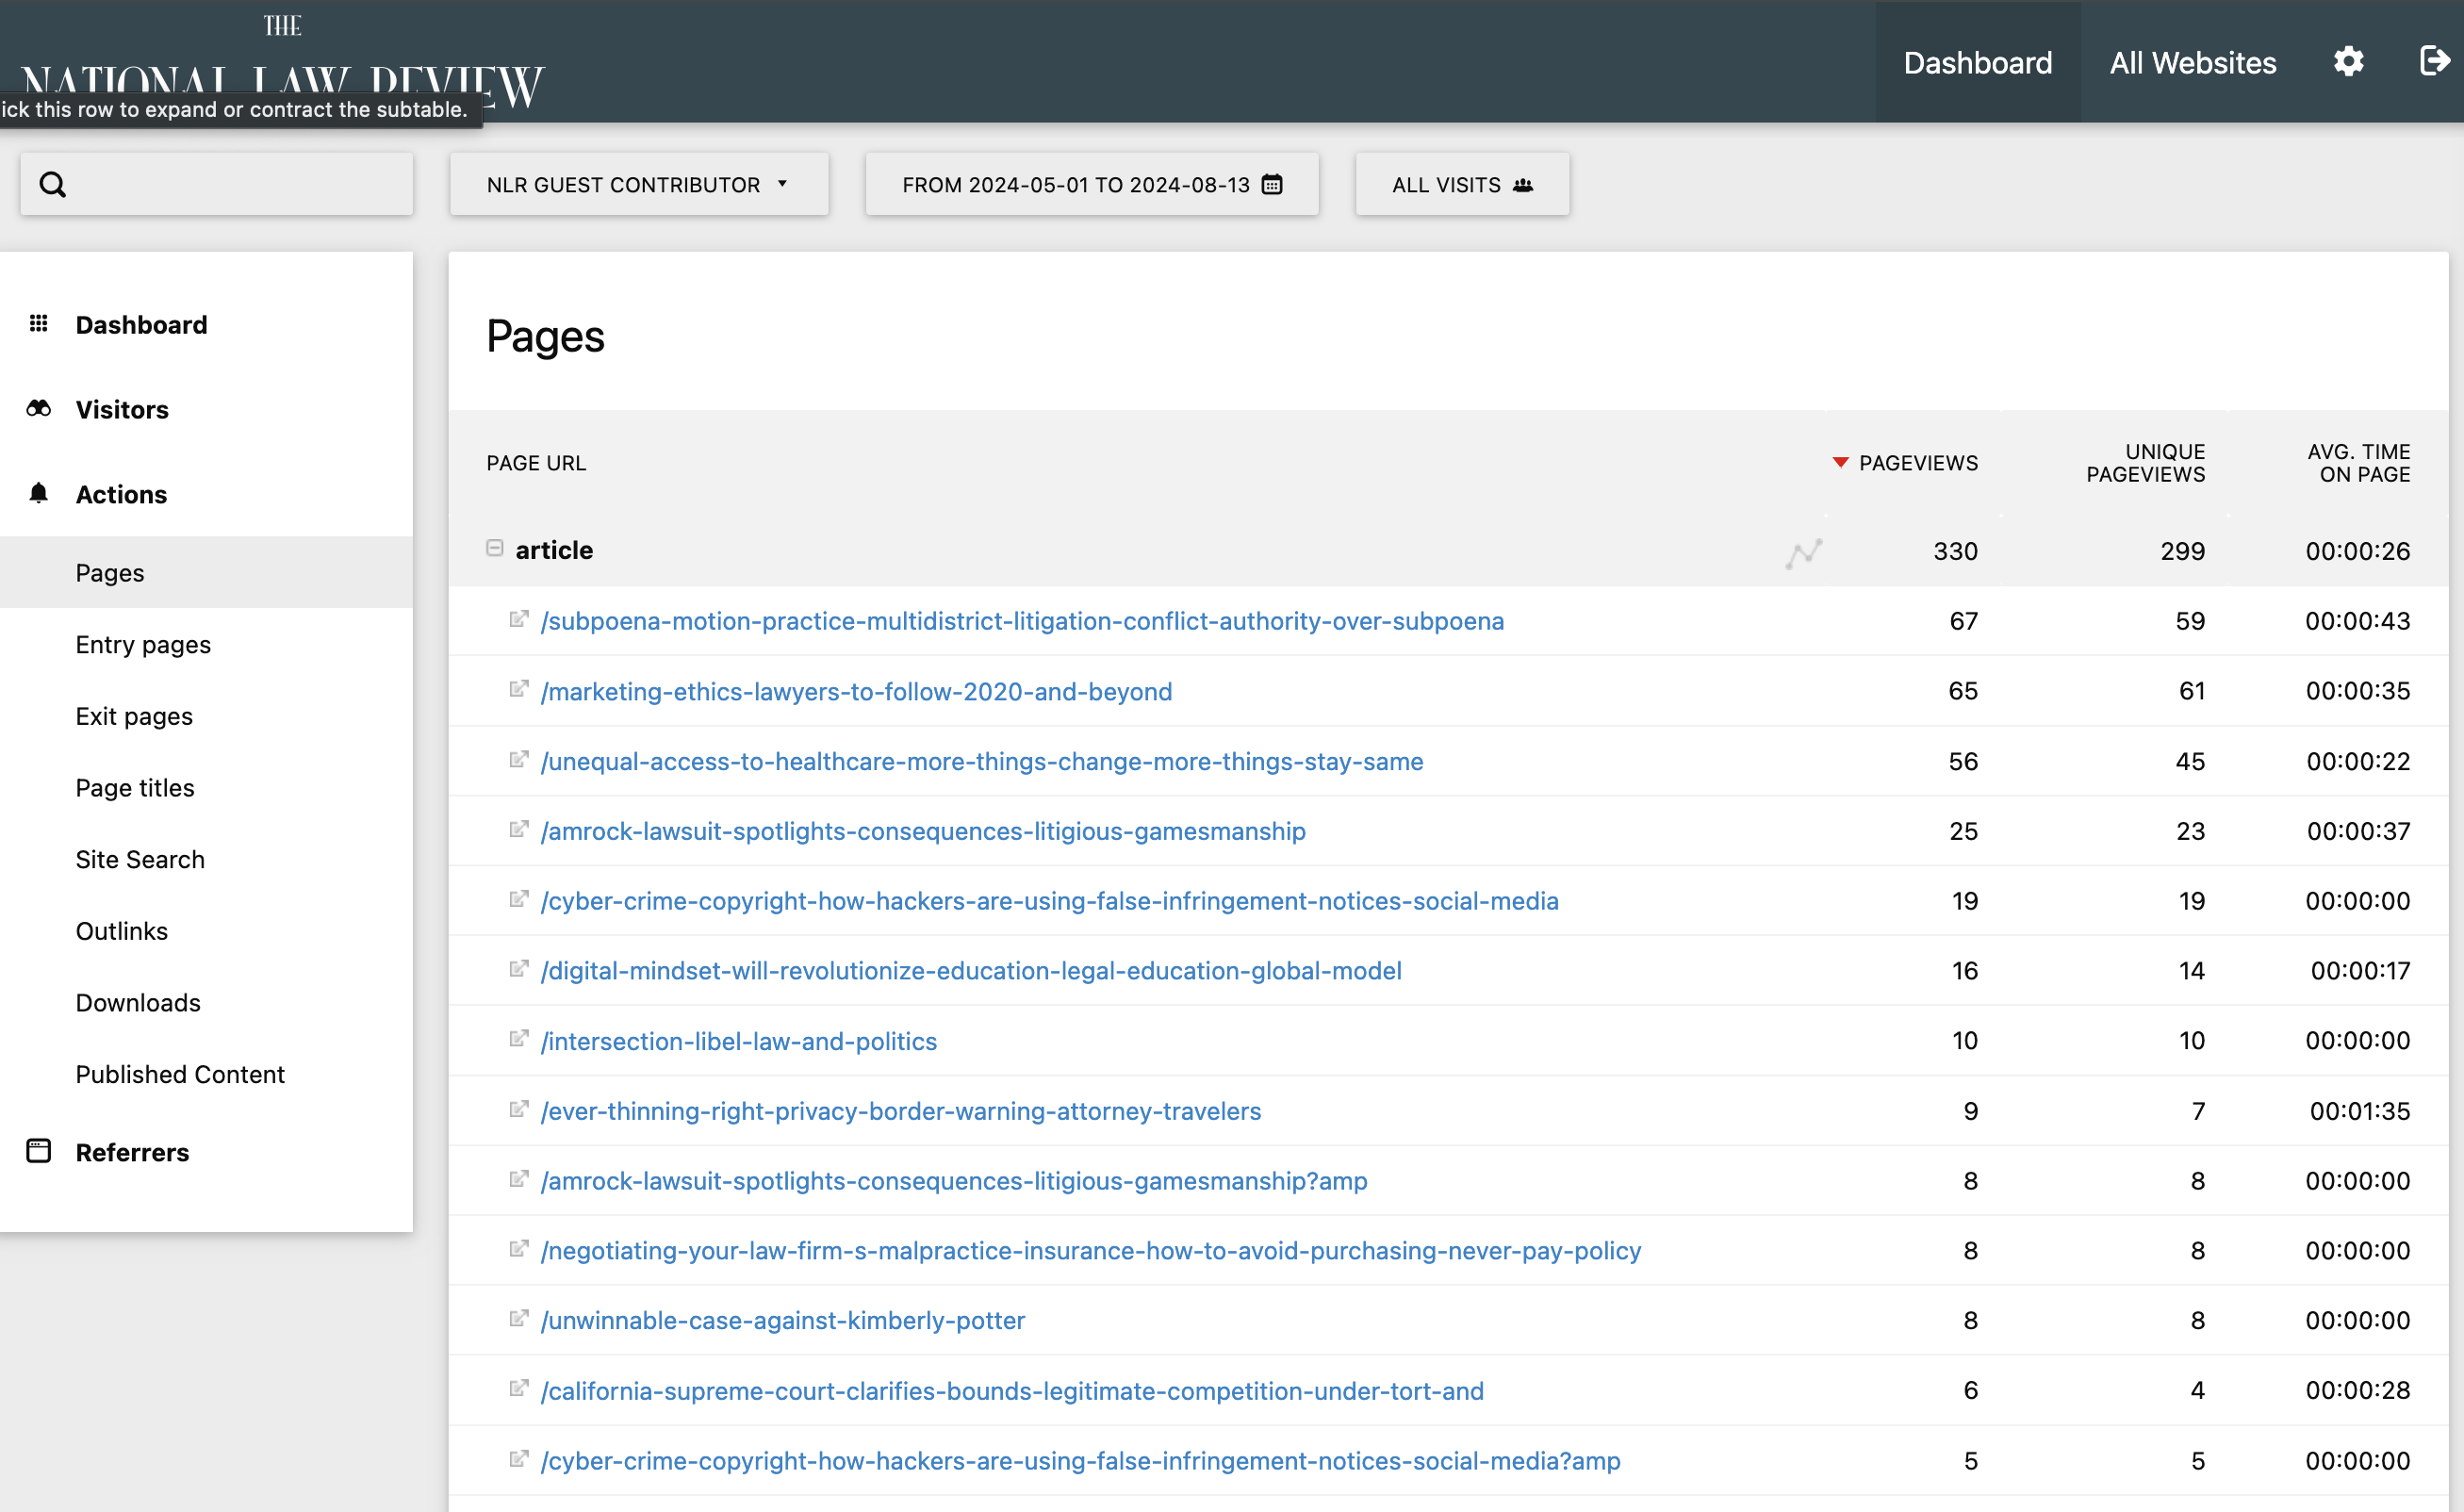
In the left navigation menu, click on Actions, then Pages, and then the plus [+] to open a list of your firm's articles.
-
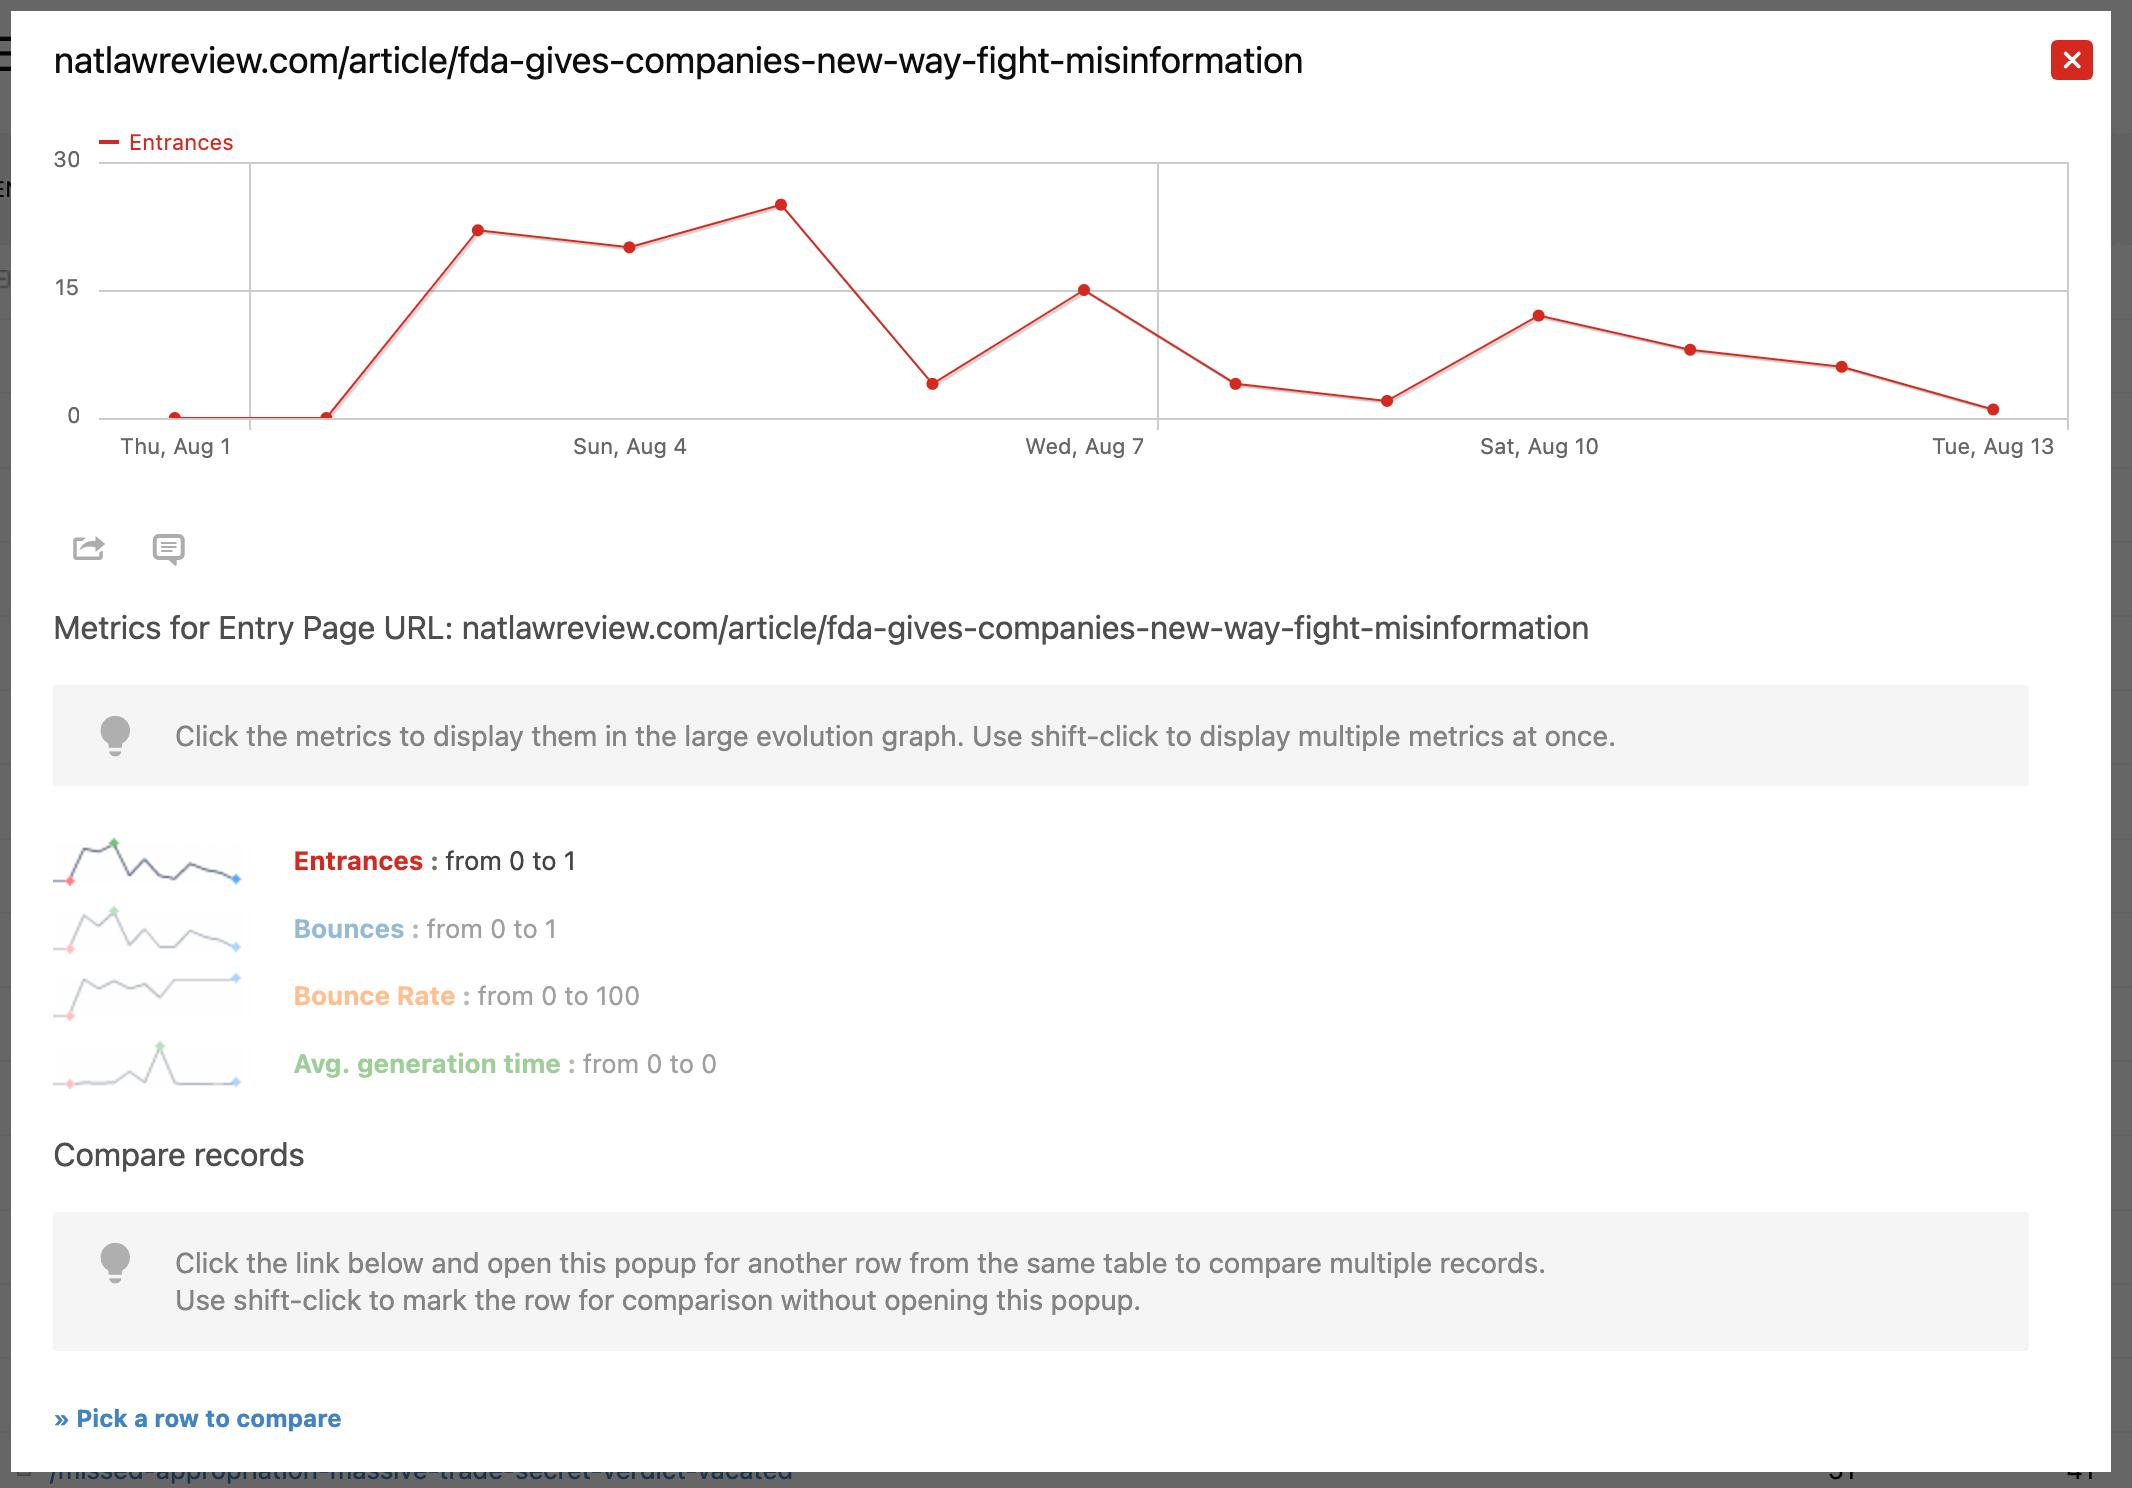
Scroll over the title of the page and you will see three icons. The icon on the left will show you the transitions and see what the visitors did before and after the page. The middle icon shows your Visitor Log, The icon on the right will show you how the metrics changed over time (Row Evolution).
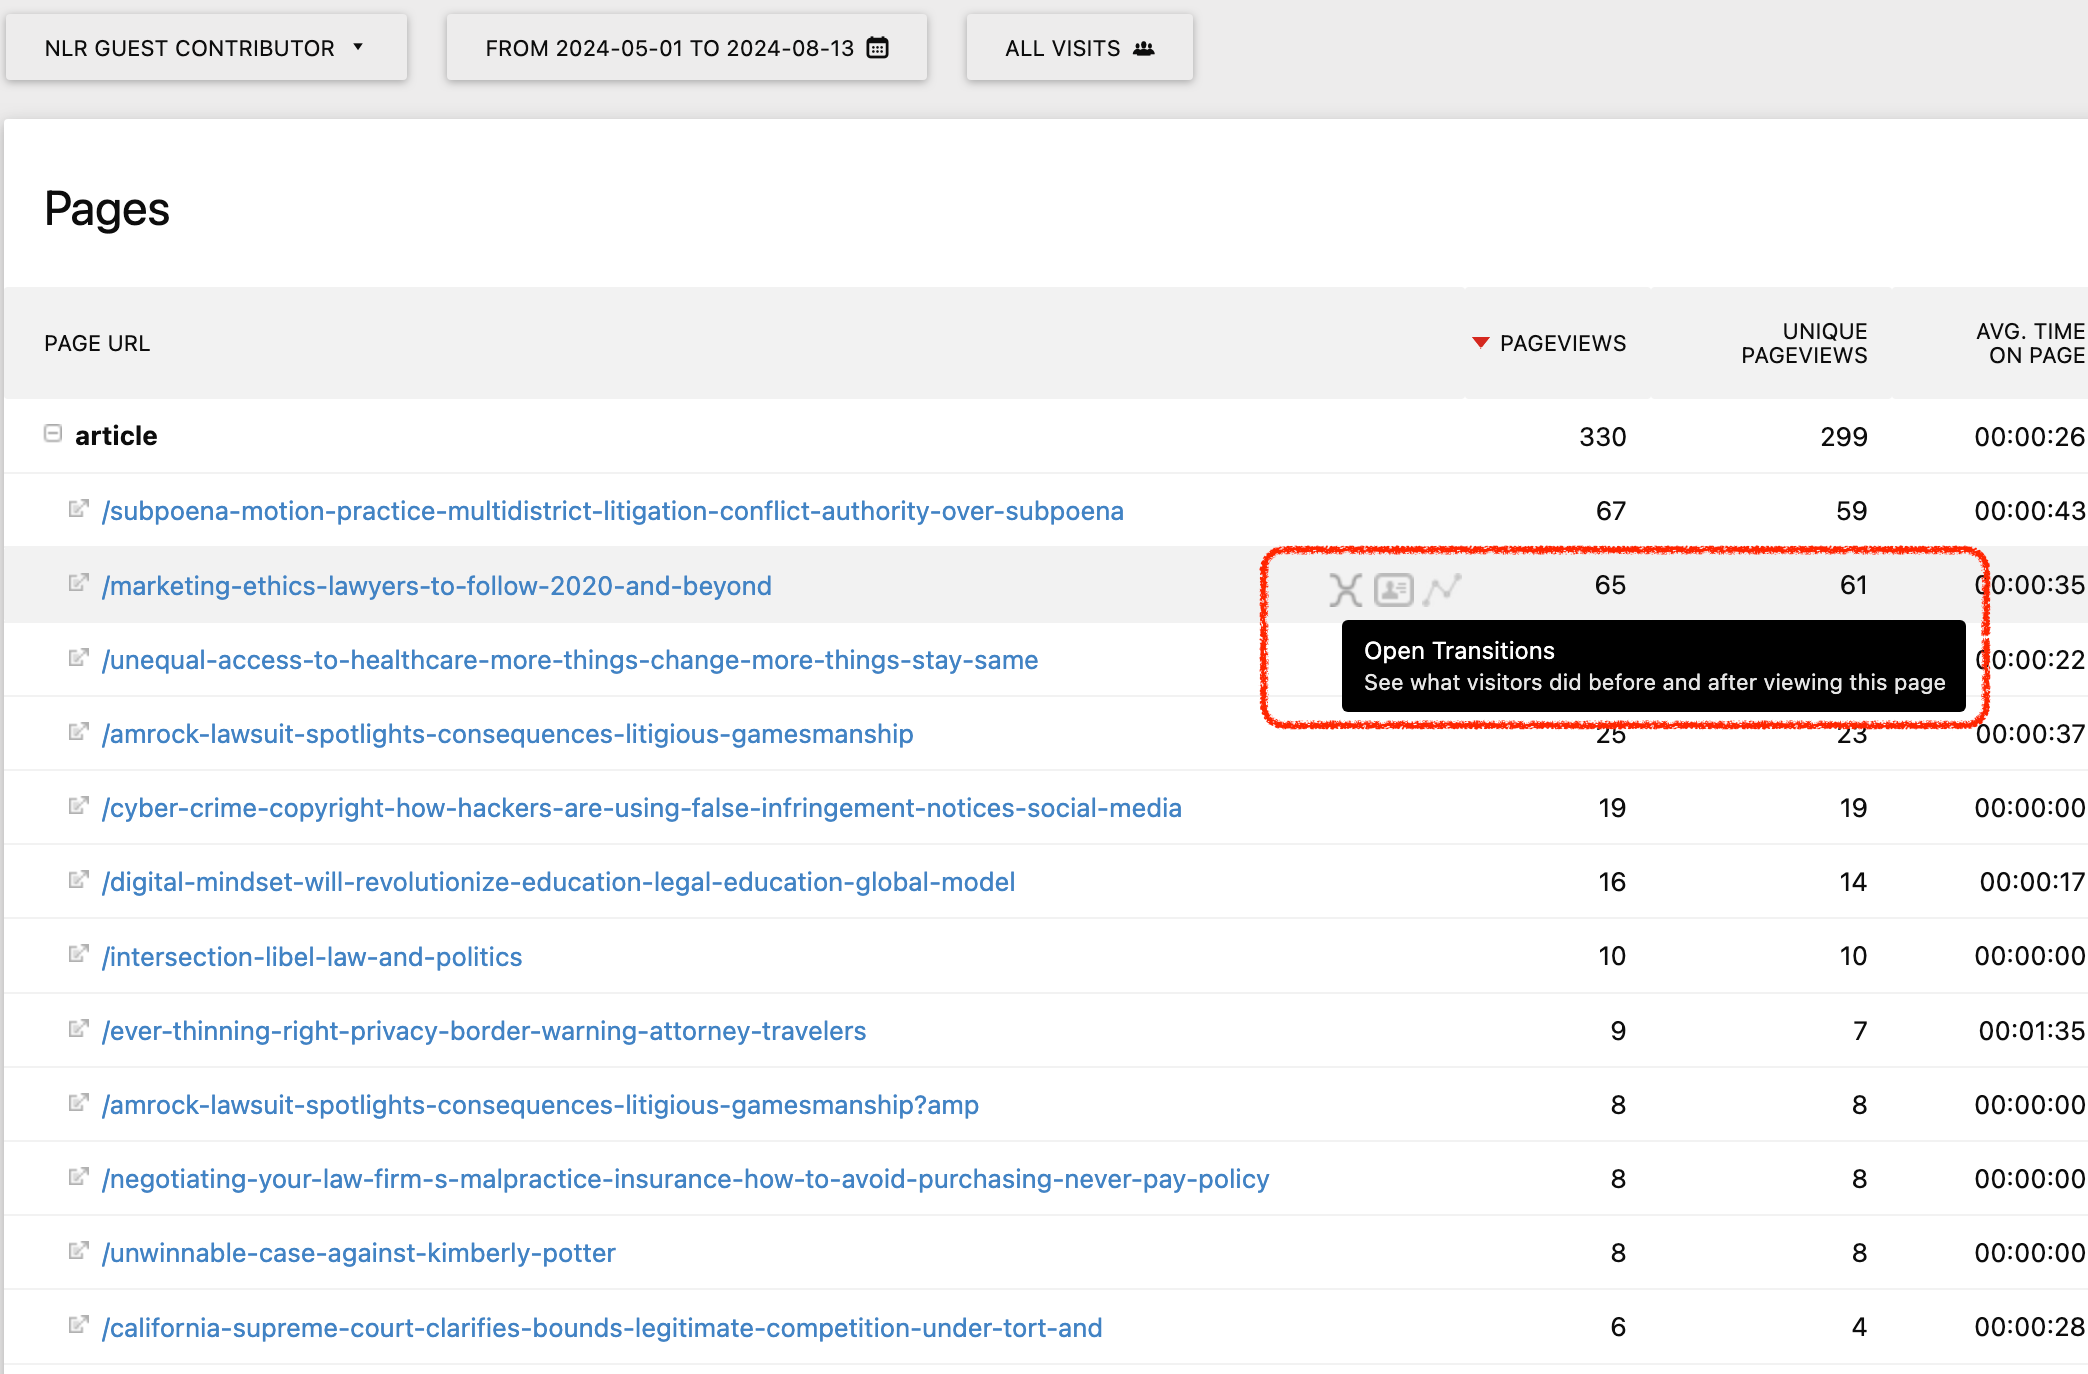
-
The left icon will open a box that will show you the following:
-
The title of the Article and how many page views and unique pageviews this article received. Also, the average time spent on the page.
-
Internal Pages: The user was on a different NLR page and clicked to get into this article page which will show percentages of where the user came from.
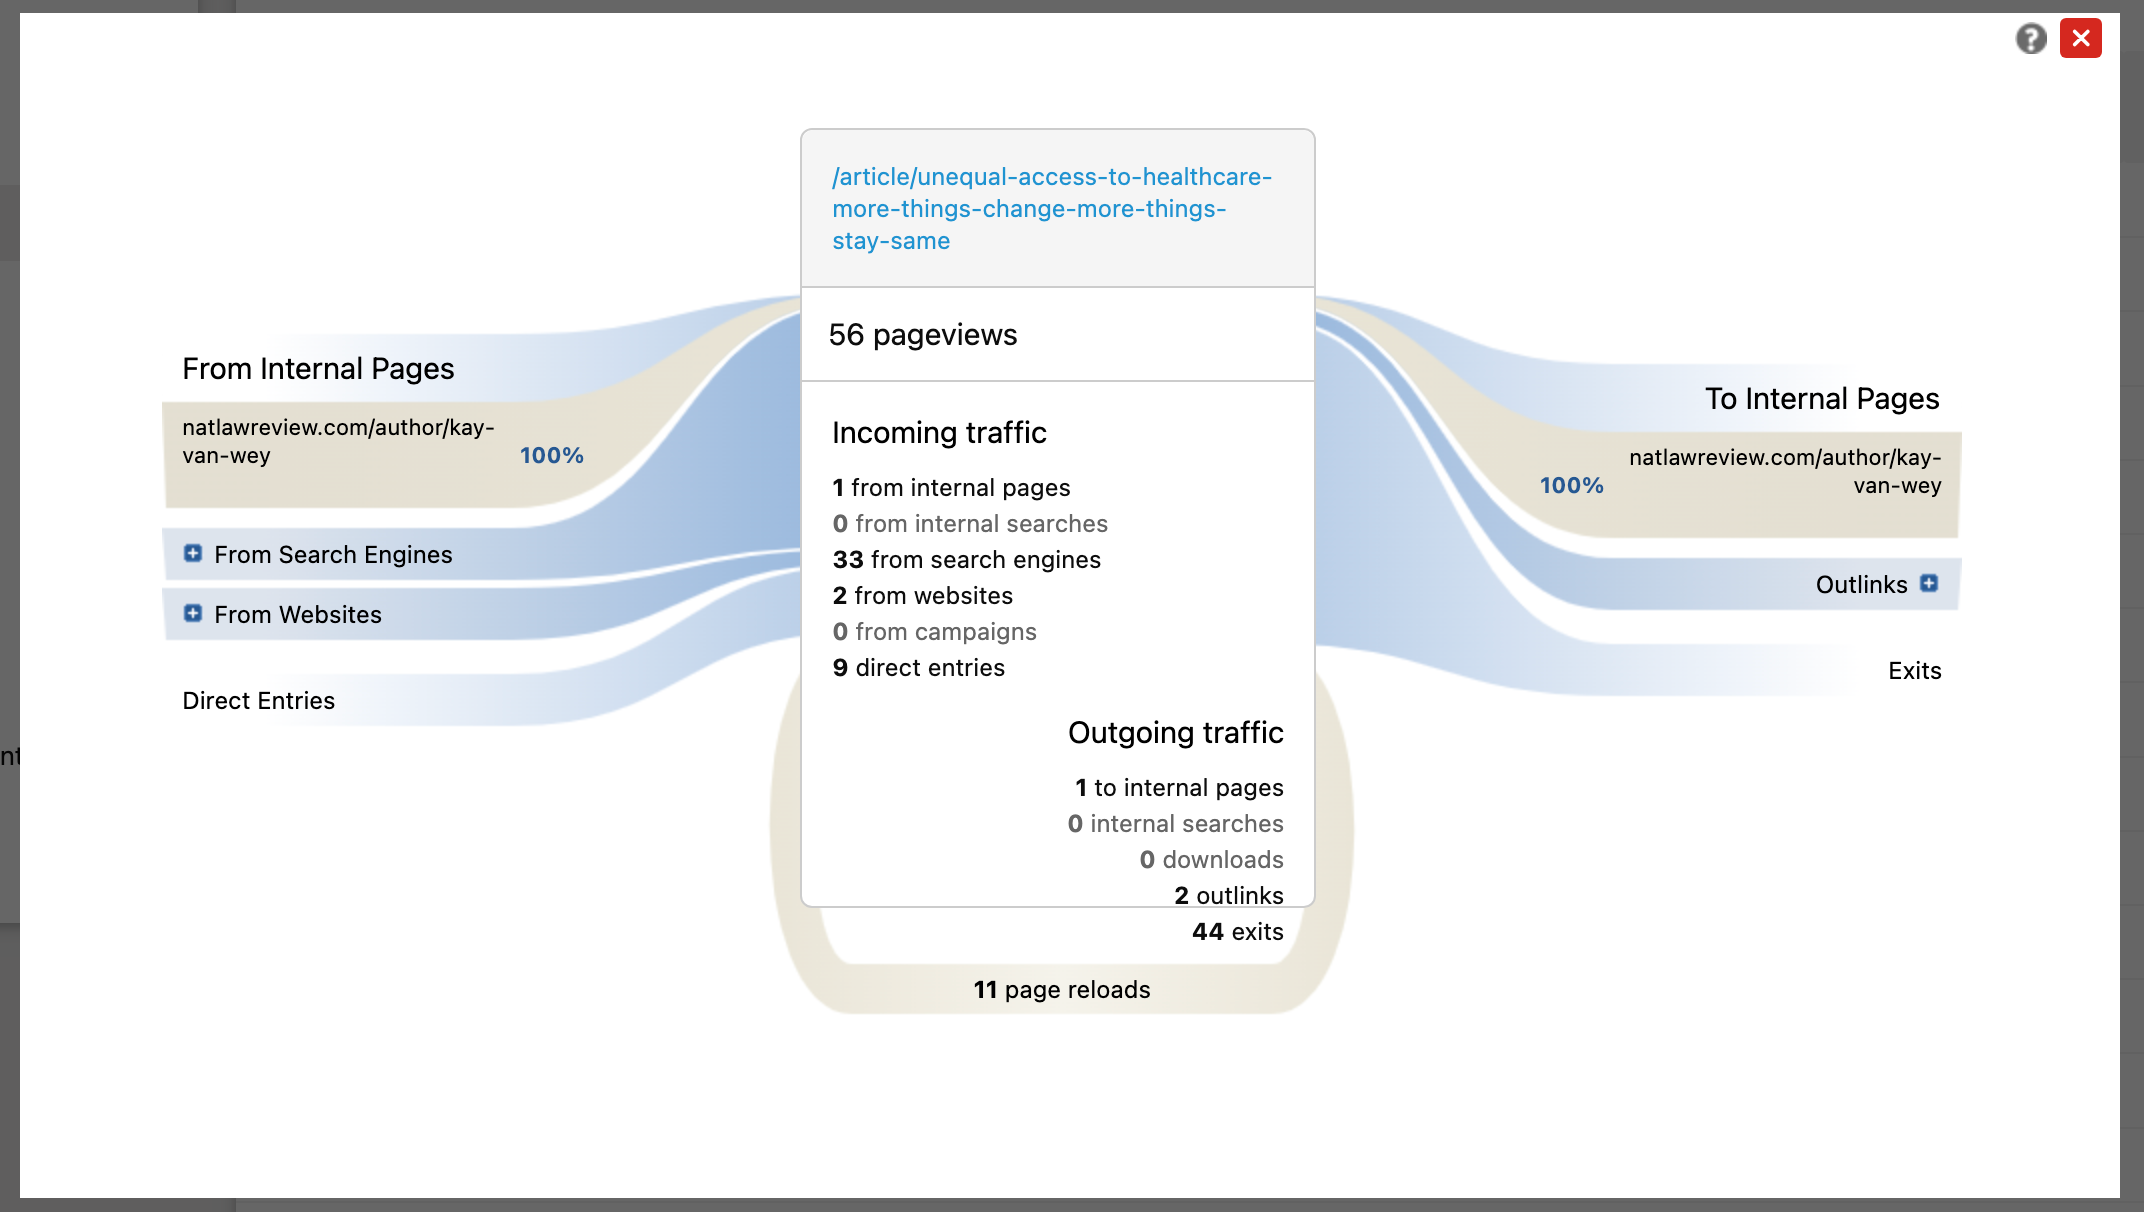
-
Search Engines: This shows where people came in from search engines such as Google and others outside the website. You can see what percentage of the users came in from what outside entity.
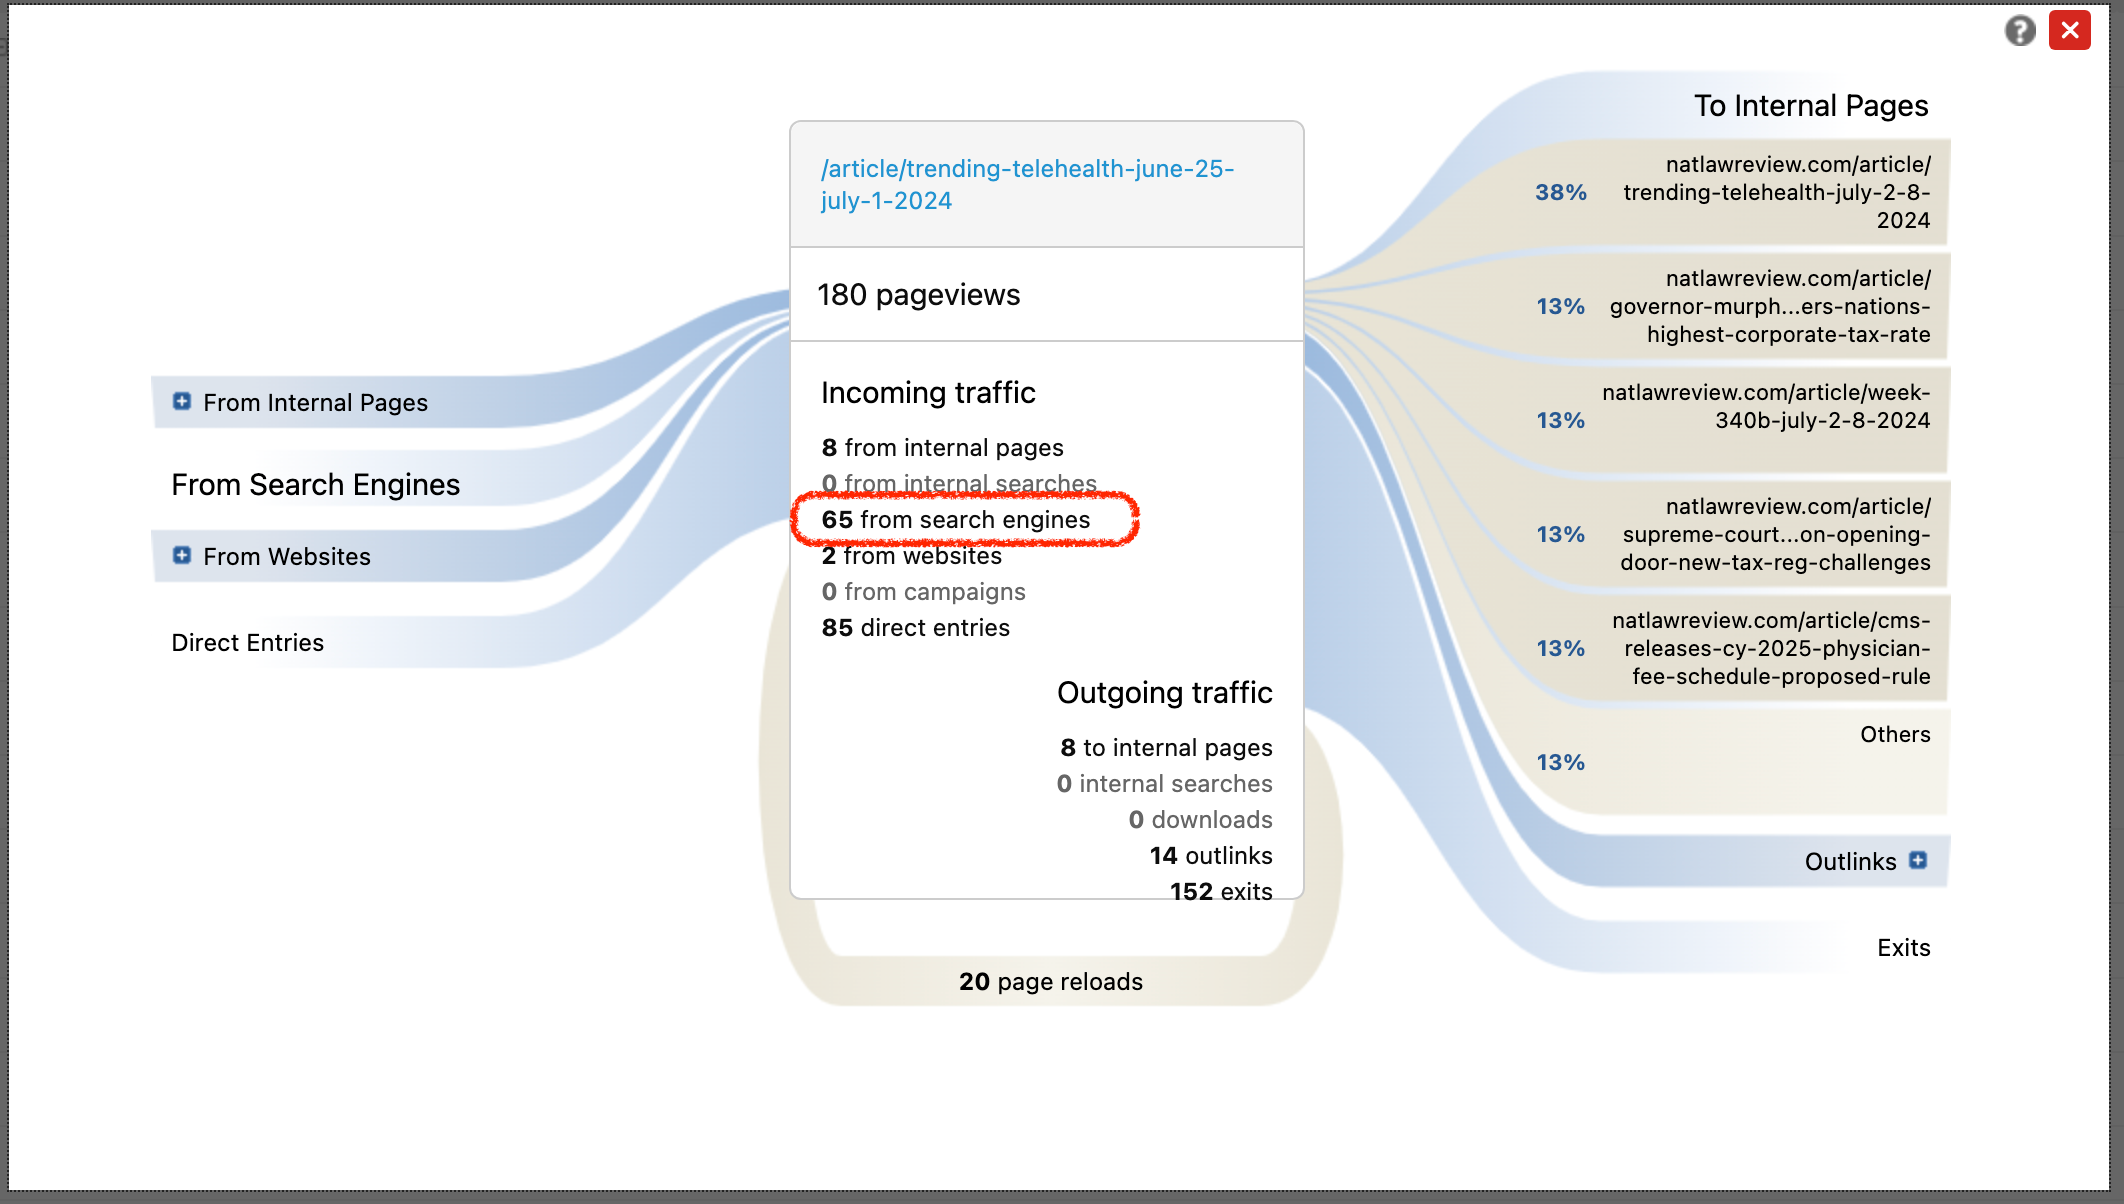
-
Websites: This showed which external websites linked directly to the page. If you expand this section, you will see what websites they came from such as Linkedin, Facebook, Google News etc.
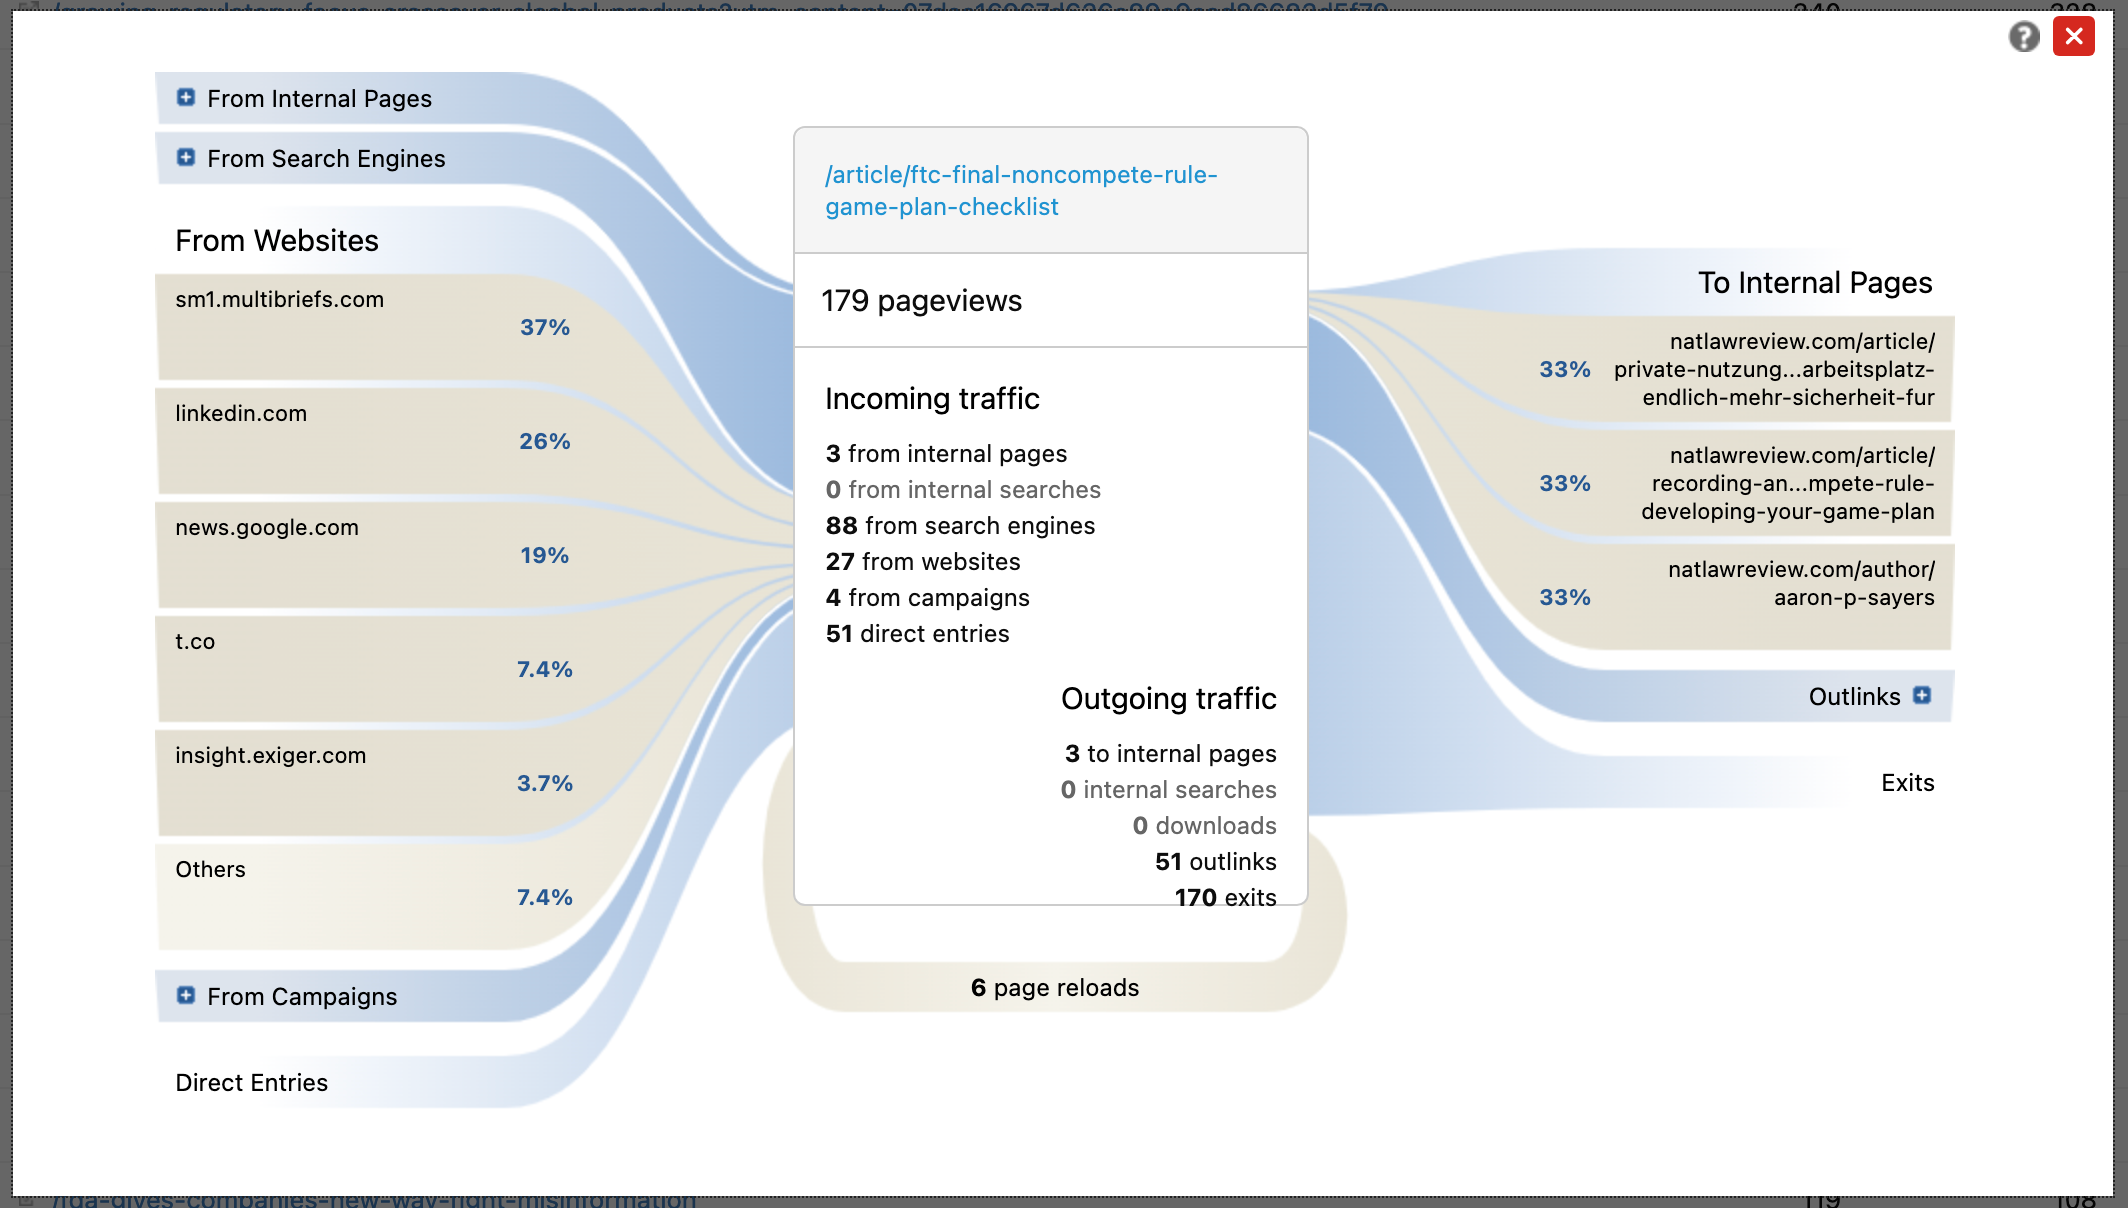
-
To Internal Pages: Shows where the user went after seeing your article.
-
The Icon on the left gives you a Dashboard of Pageviews, Unique pageviews, and average time on the article.
VISITORS
Overview: "Visits over time" gives Unique visits and how long someone stayed in the article. Also, what kind of actions the reader has taken, such as downloading an item.
Visitor Log: There is a lot of information on this part. You can see the Date of the Visit and their IP address. The Provider is who is their internet provider and sometimes you will see the firm or company name. You will see a Flag and if you scroll over this you will see where exactly this person came from including the country, the state, and the city. Next to the right is the Action - essentially, which article they were looking at. The far right is “View Visitor Profile”. This is more information for the viewer. You can also export this data in a CSV format at the bottom of the page.
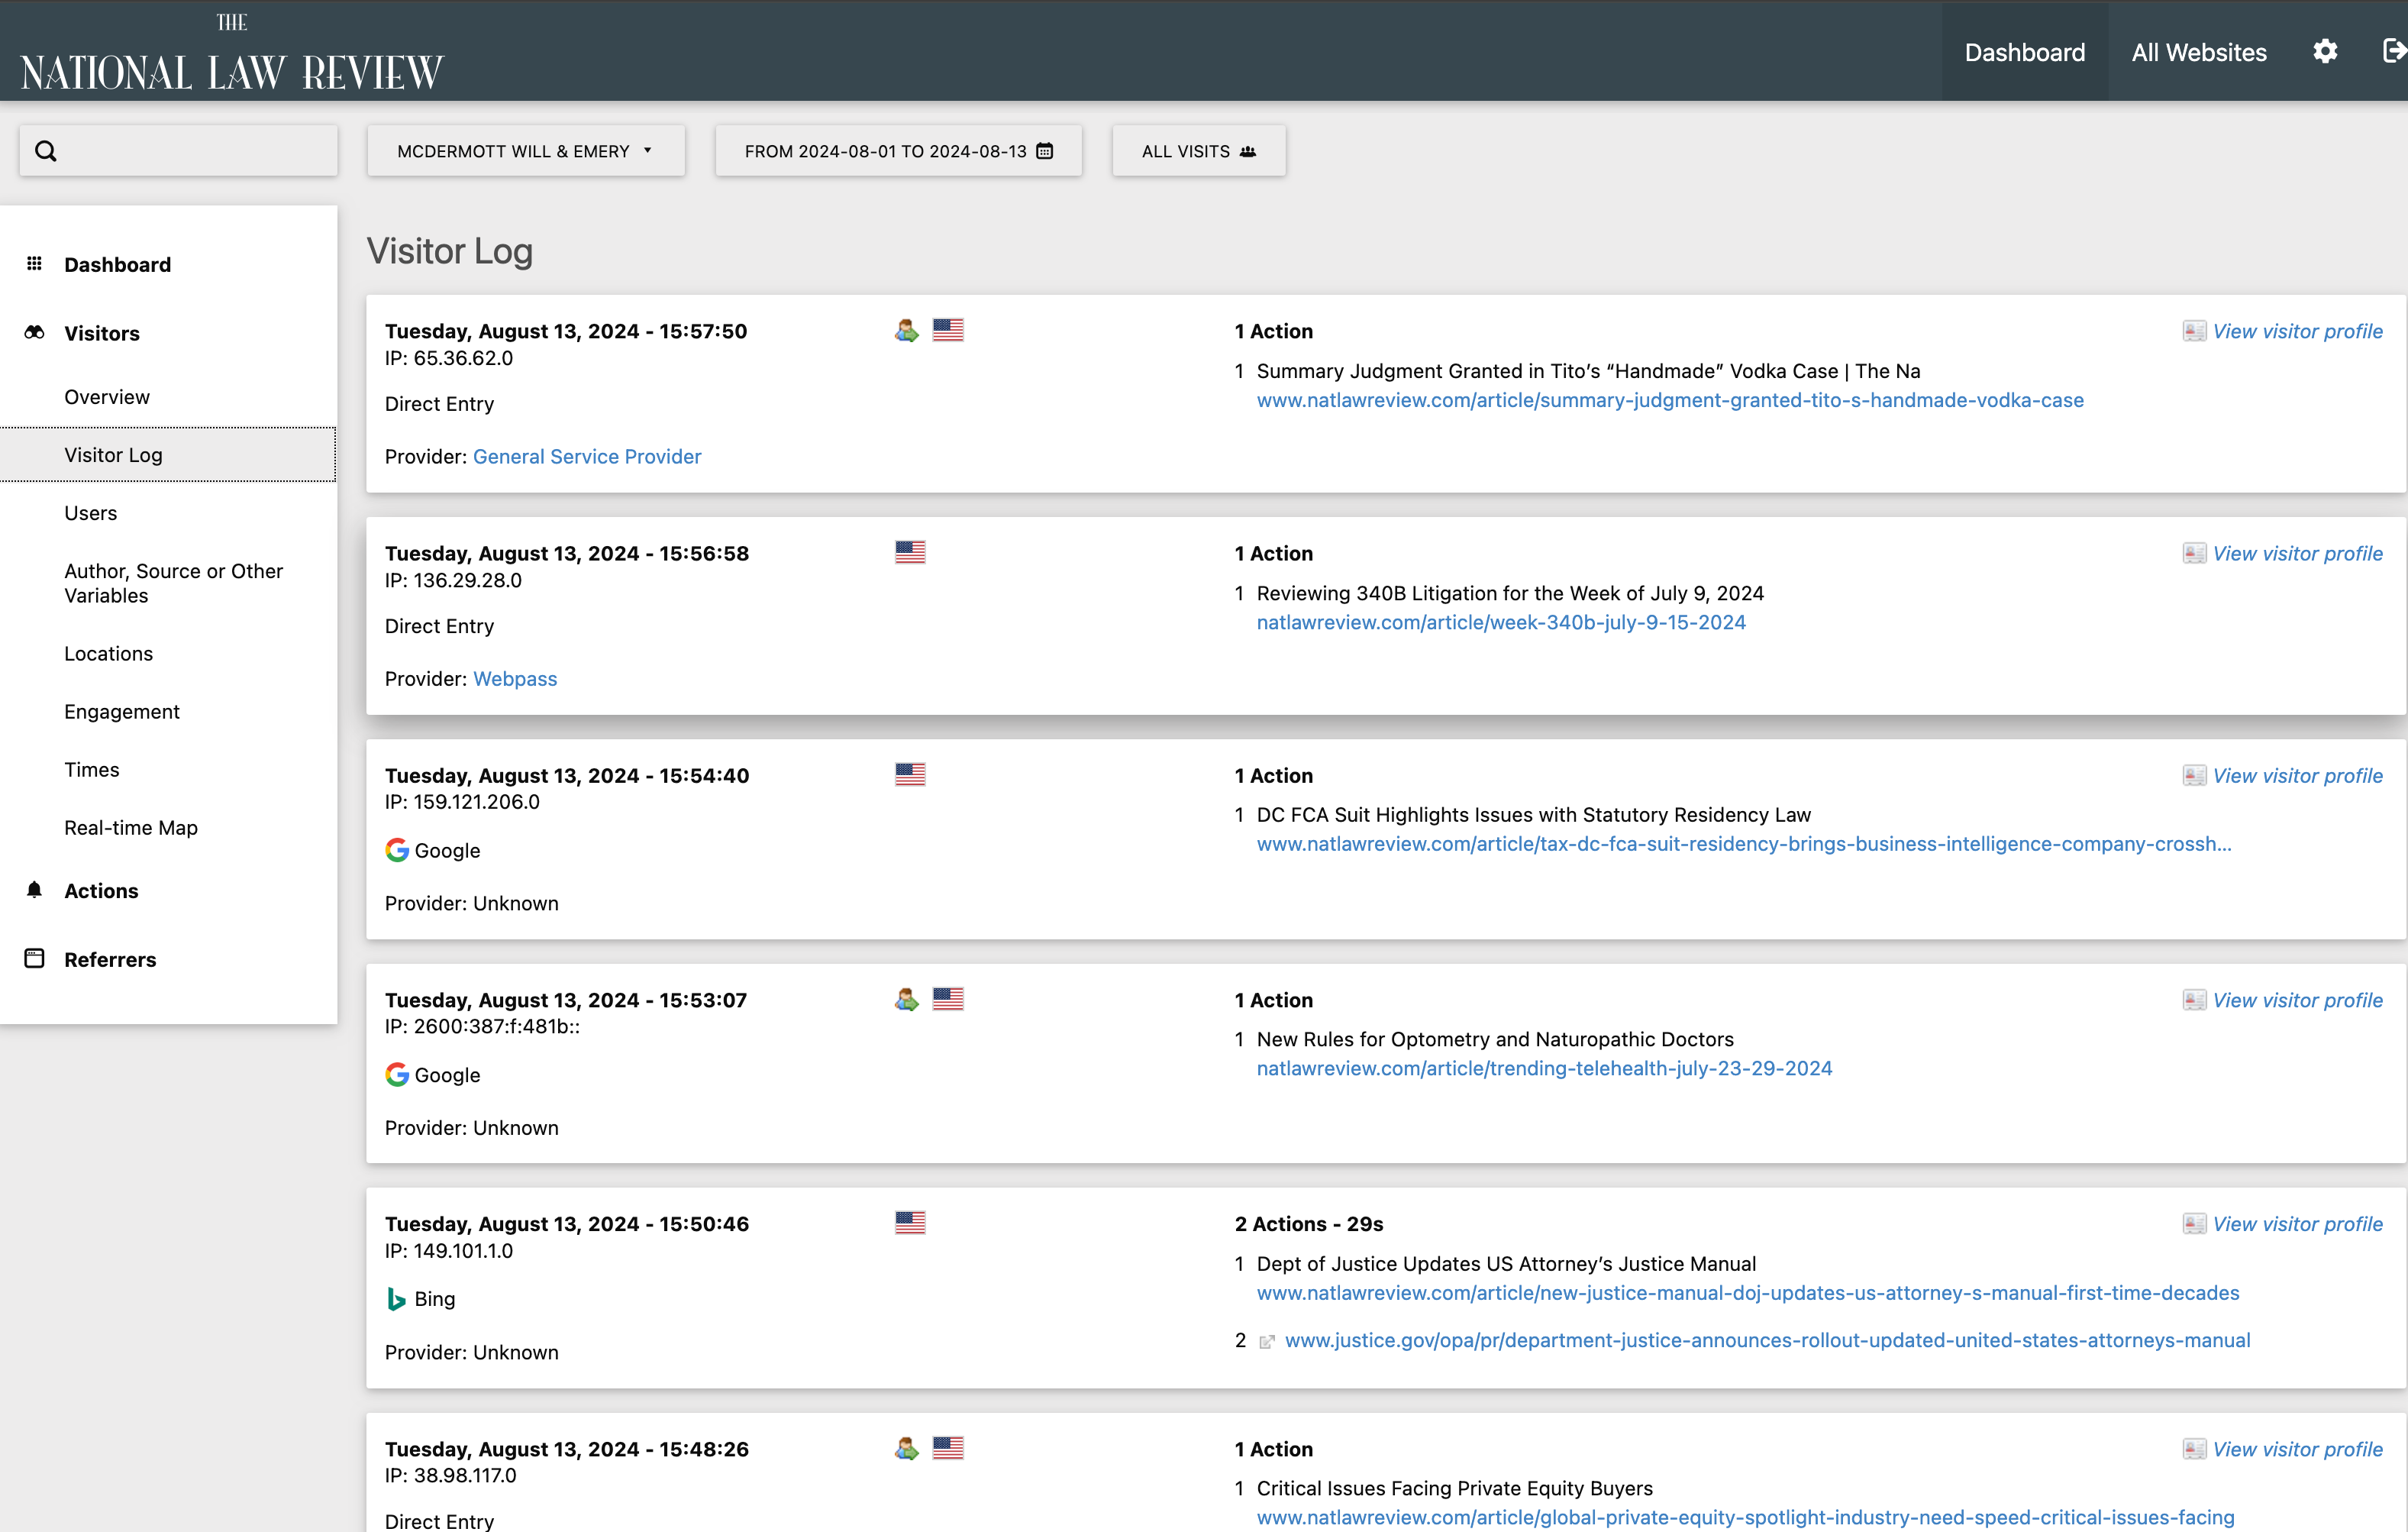
If you see a person icon, as shown next to the second visitor profile above, this means this is a returning visitor.
Locations: The Live Map of the United States:

Locations also show the Ranking of the Countries. Mainly the United States as the first, then you may see the UK, India, Canada, Philippines, France, Germany, Australia, South Africa, and UAE to name a few. Also, ranks State, Continents, and Languages
Engagement: This section shows engagements over time, returning visits and frequency over visits along with duration and visits by visit numbers.
Times: These are the visits by Local time and Server time.
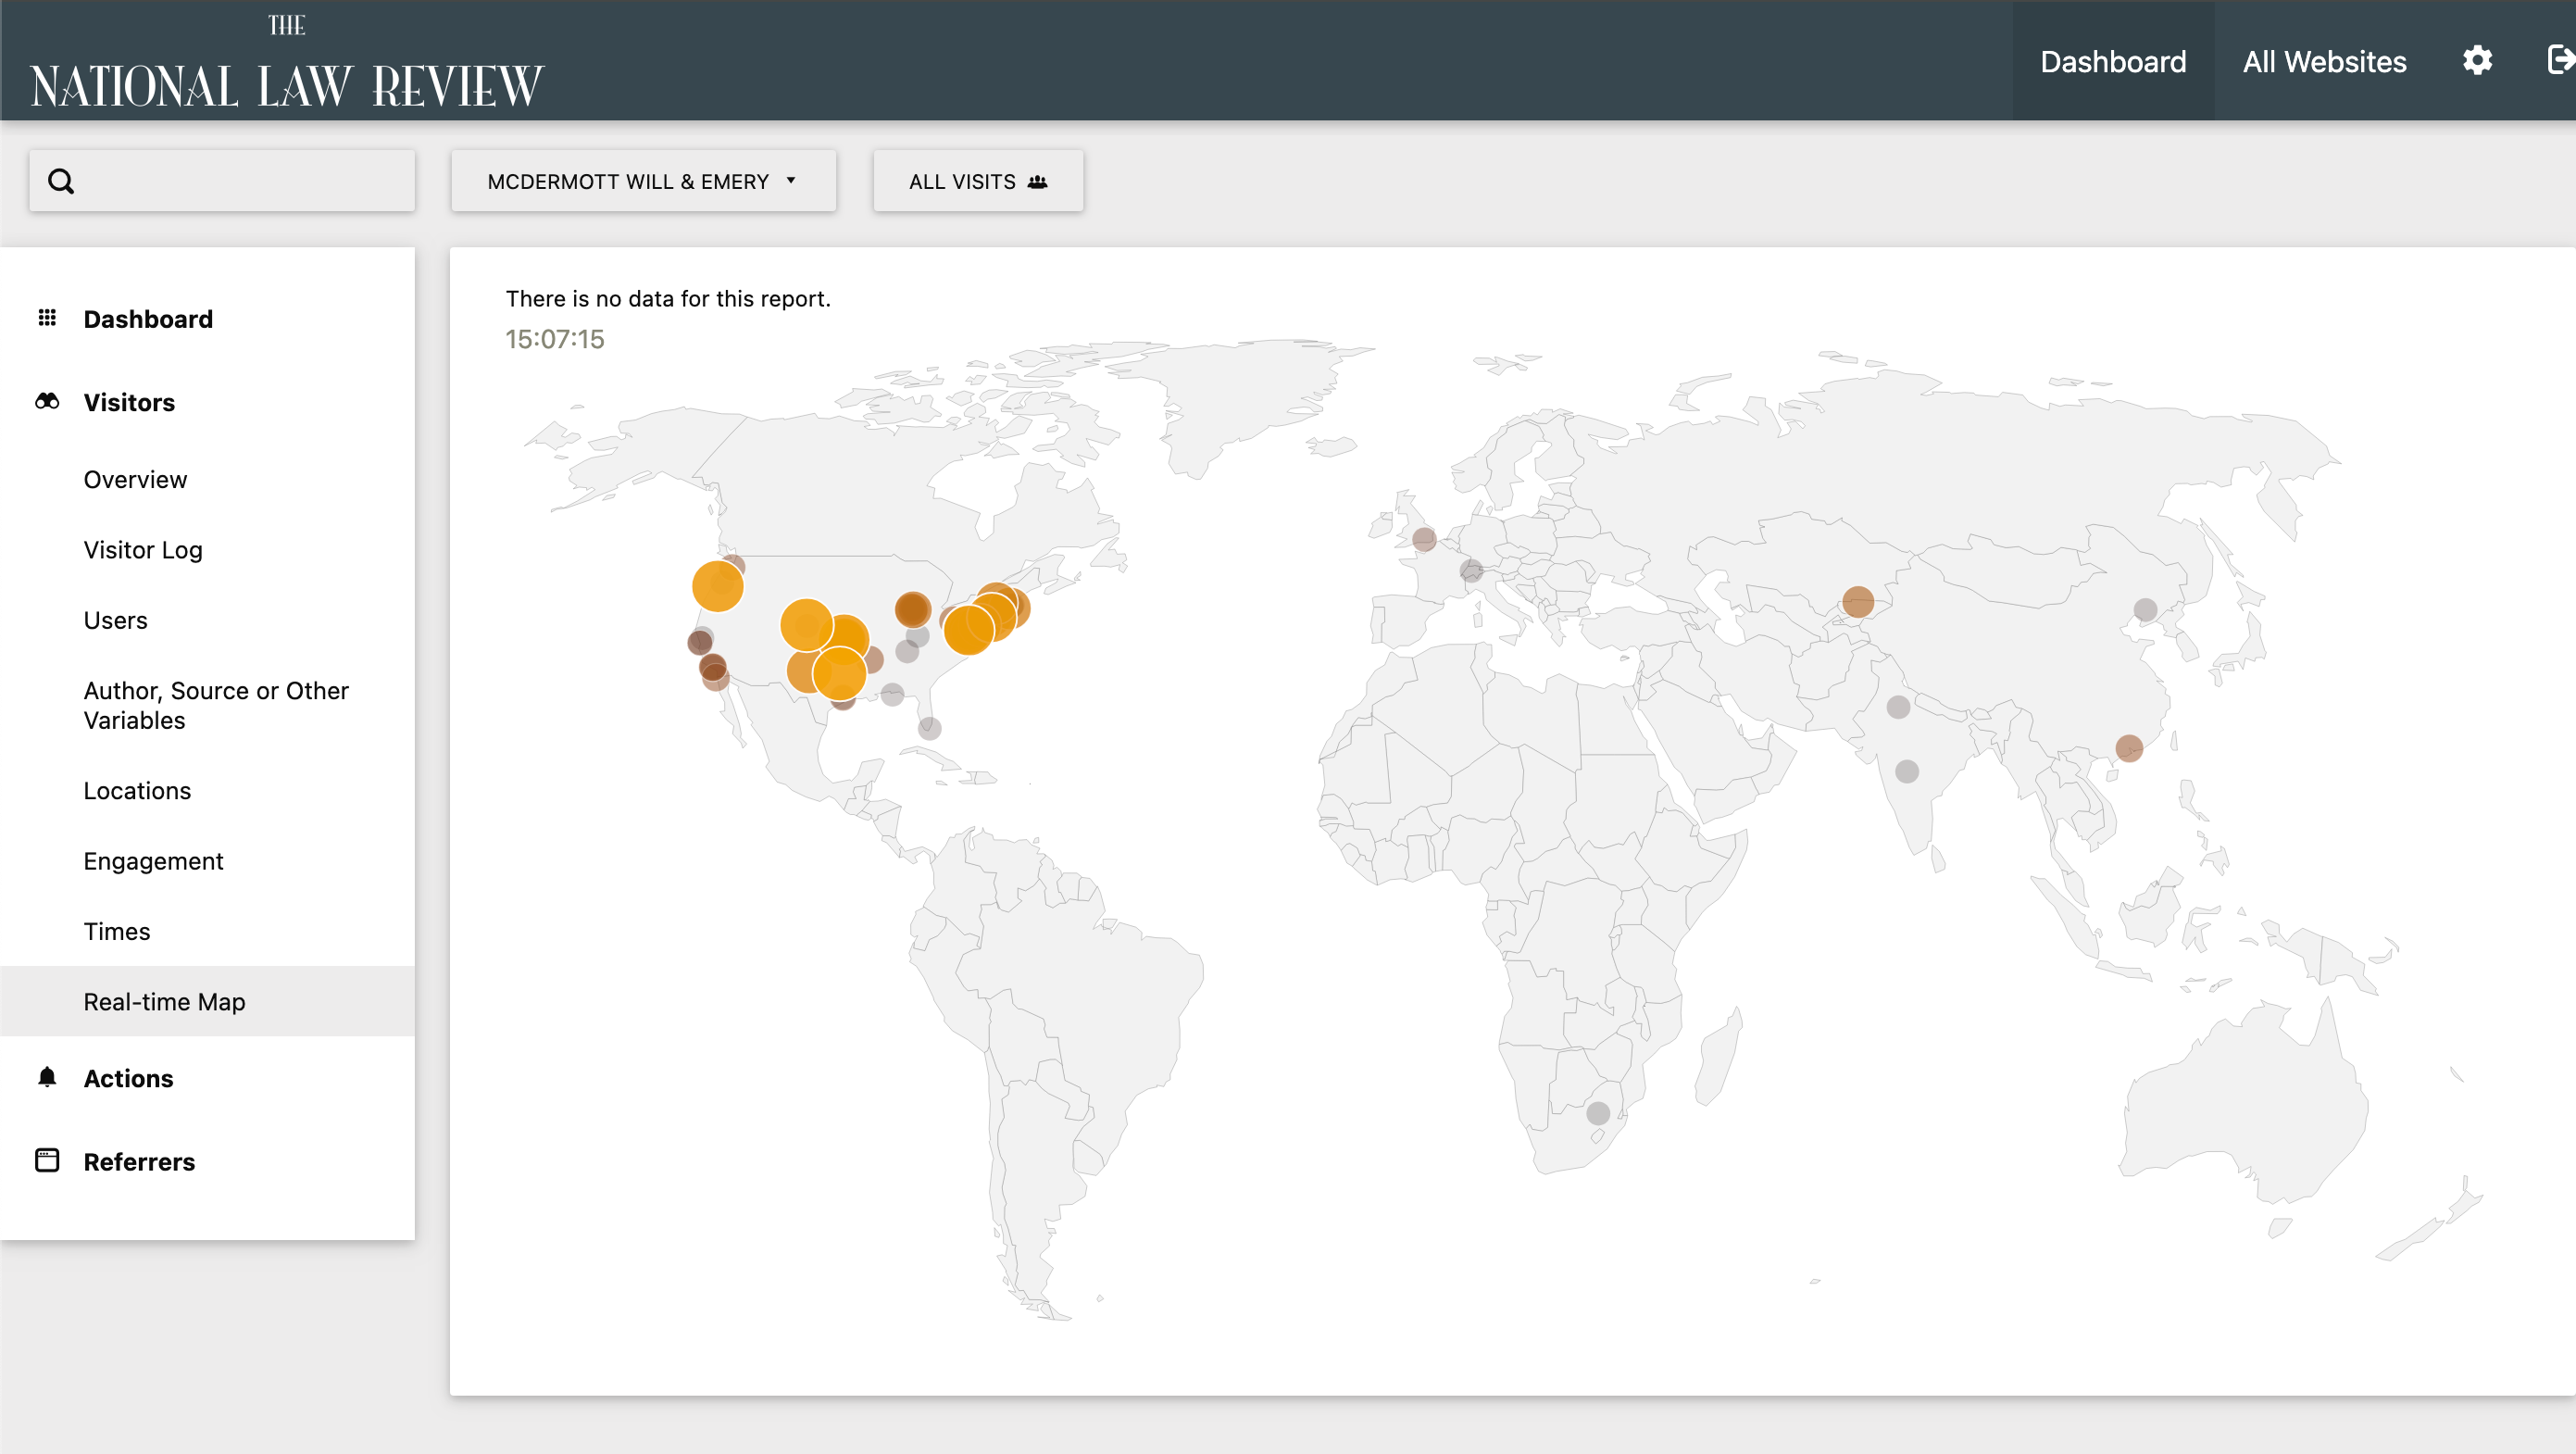
Real-Time Global Map: Geo-located visits live around the world.
The National Law Review is committed to providing our publishing partners with analytical insights that can drive ROI. Please feel free to reach out to articleupdates@natlawreview.com to get any of your questions answered, or to provide feedback on what kind of data you’re firm is interested in capturing.

